
Fig. 3.
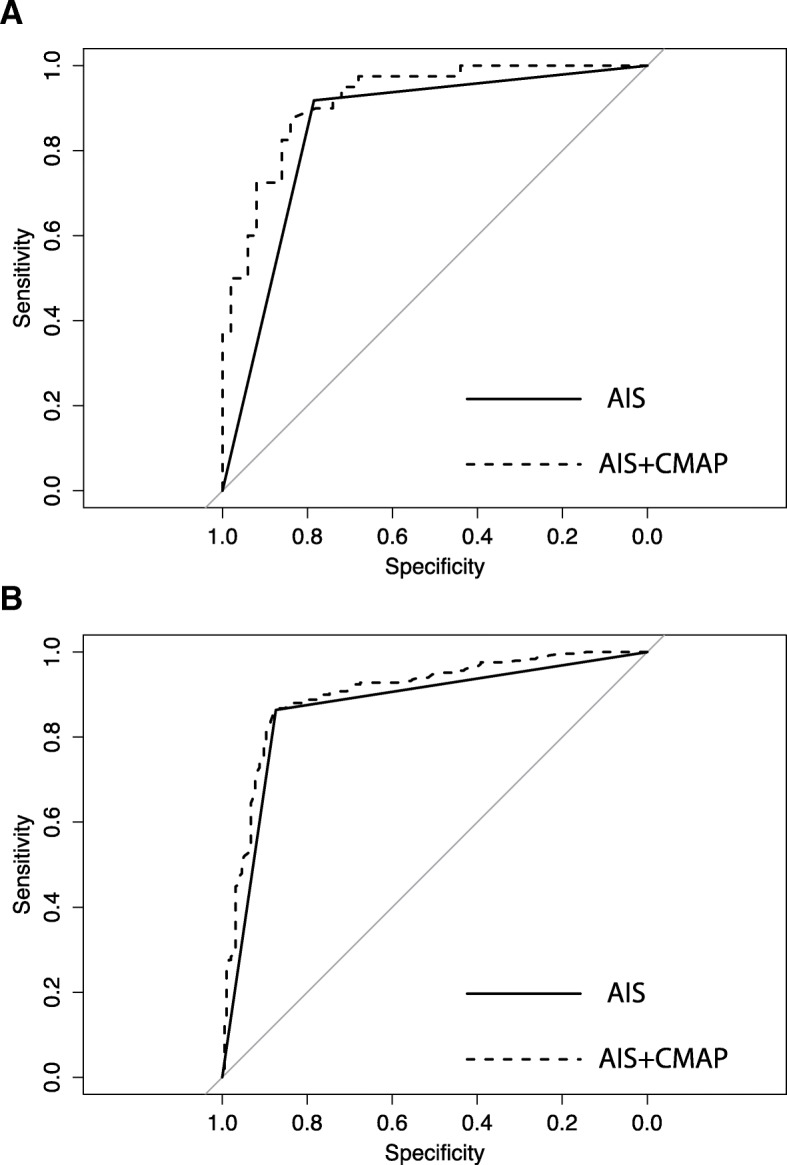
ROC curve analysis of logistic regression results. The solid line represents the logistic fit of the initial AIS (within first 4 weeks) for the prediction of good recovery AIS D versus A-C. The dashed line represents the logistic model fit of initial AIS + initial right ulnar nerve CMAP amplitude. The improved prediction accuracy of the full model (initial AIS + initial CMAP) versus initial AIS alone is significant in the EMSCI-HD (a) and EMSCI-nonHD (b) cohorts, respectively (p = 0.0017 and 0.0003). Complete-case analysis. (EMSCI-HD cohort n = 90; EMSCI-nonHD cohort n = 444)