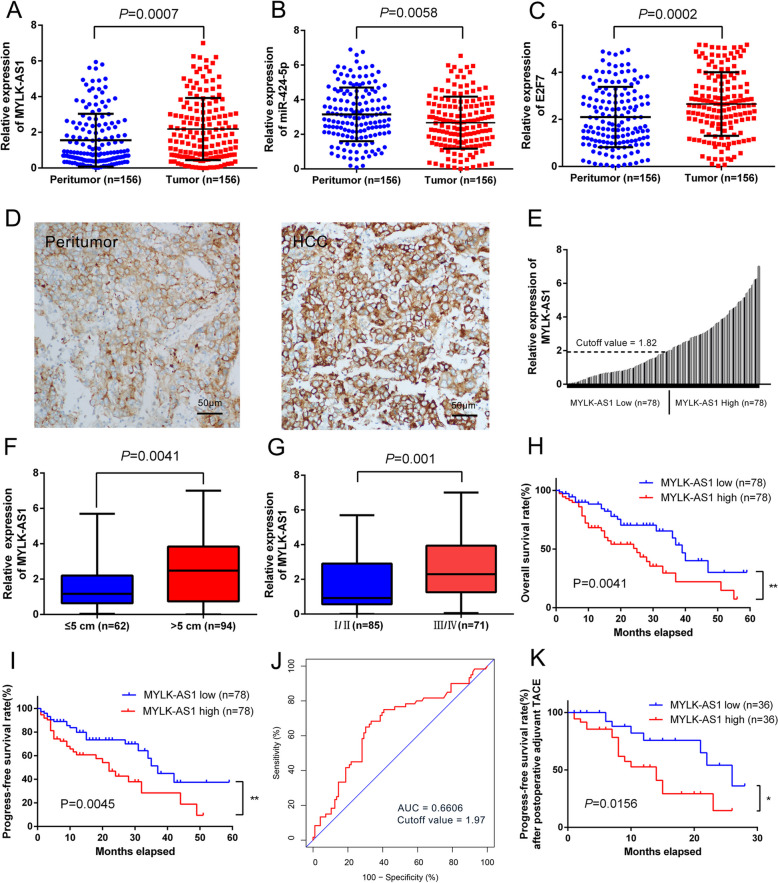
Fig. 2.
MYLK-AS1 and E2F7 overexpression is positively correlated with HCC progression and poor prognosis. a-c Relative expression of MYLK-AS1, miR-424-5p and E2F7 detected by qRT-PCR in 156 paired HCC cancer tissues and matched normal liver tissues. Results are presented as the relative expression (compare to internal control, the 2-△△CT method) in tumor tissues and peritumoral tissues. d MYLK-AS1 expression in peritumoral tissues and HCC tissues by ISH. e Relative MYLK-AS1 expression by qRT-PCR in 156 HCC tissues. Relative MYLK-AS1 expression presented as the relative expression (compare to internal control, the 2-△△CT method) in tumor tissues and the matched normal tissues. HCC patients were divided into high (n = 78) and low (n = 78) group according to the median value (0.50). f-g Relative MYLK-AS1 expression in HCC with different size and stage. Results were presented as the relative expression (compare to internal control, the 2-△△CT method) in tumor tissues and normal tissues. h-i Kaplan-Meier plots of the OS and PFS of HCC patients with high (n = 78) and low (n = 78) MYLK-AS1 expression. Data are presented as mean ± SD. *P < 0.05, **P < 0.01, and ***P < 0.001. j ROC analysis of the performance of MYLK-AS1 expression of 1-year OS in all patients. K Kaplan-Meier plots of the PFS of HCC patients after postoperative adjuvant TACE therapy with high (n = 36) and low (n = 36) MYLK-AS1 expression. Data are presented as mean ± SD. *P < 0.05, **P < 0.01, and ***P < 0.001

