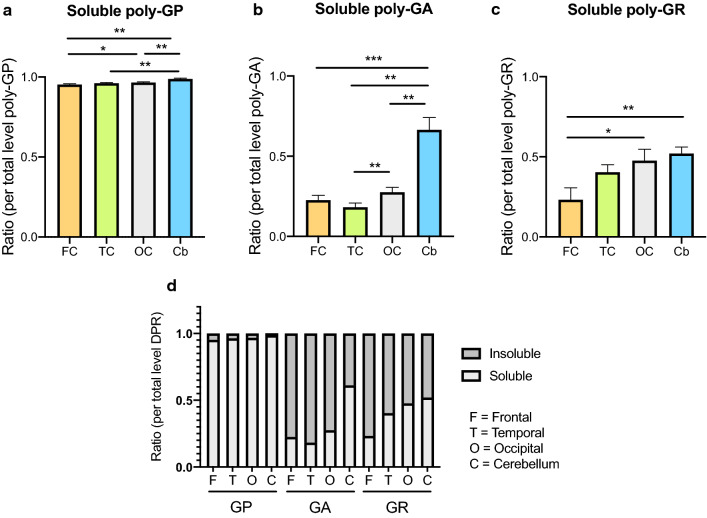
Fig. 3.
Regional solubility of DPR proteins. The ratio of soluble poly-GP (a), poly-GA (b) and poly-GR (c) are compared between frontal cortex (FC), temporal cortex (TC), occipital cortex (OC) and cerebellum (Cb). All data are mean ± SEM. Statistical analysis: Friedman test followed by Dunn’s multiple comparison test. *p < 0.05, **p < 0.01, ***p < 0.001. (d) Ratios of soluble (S) and insoluble (INS) DPR per total level of DPR in frontal cortex (F), temporal cortex (T), occipital cortex (O) and cerebellum (C). The results of the statistical analysis comparing soluble ratios in between brain regions are shown in (a–c)

