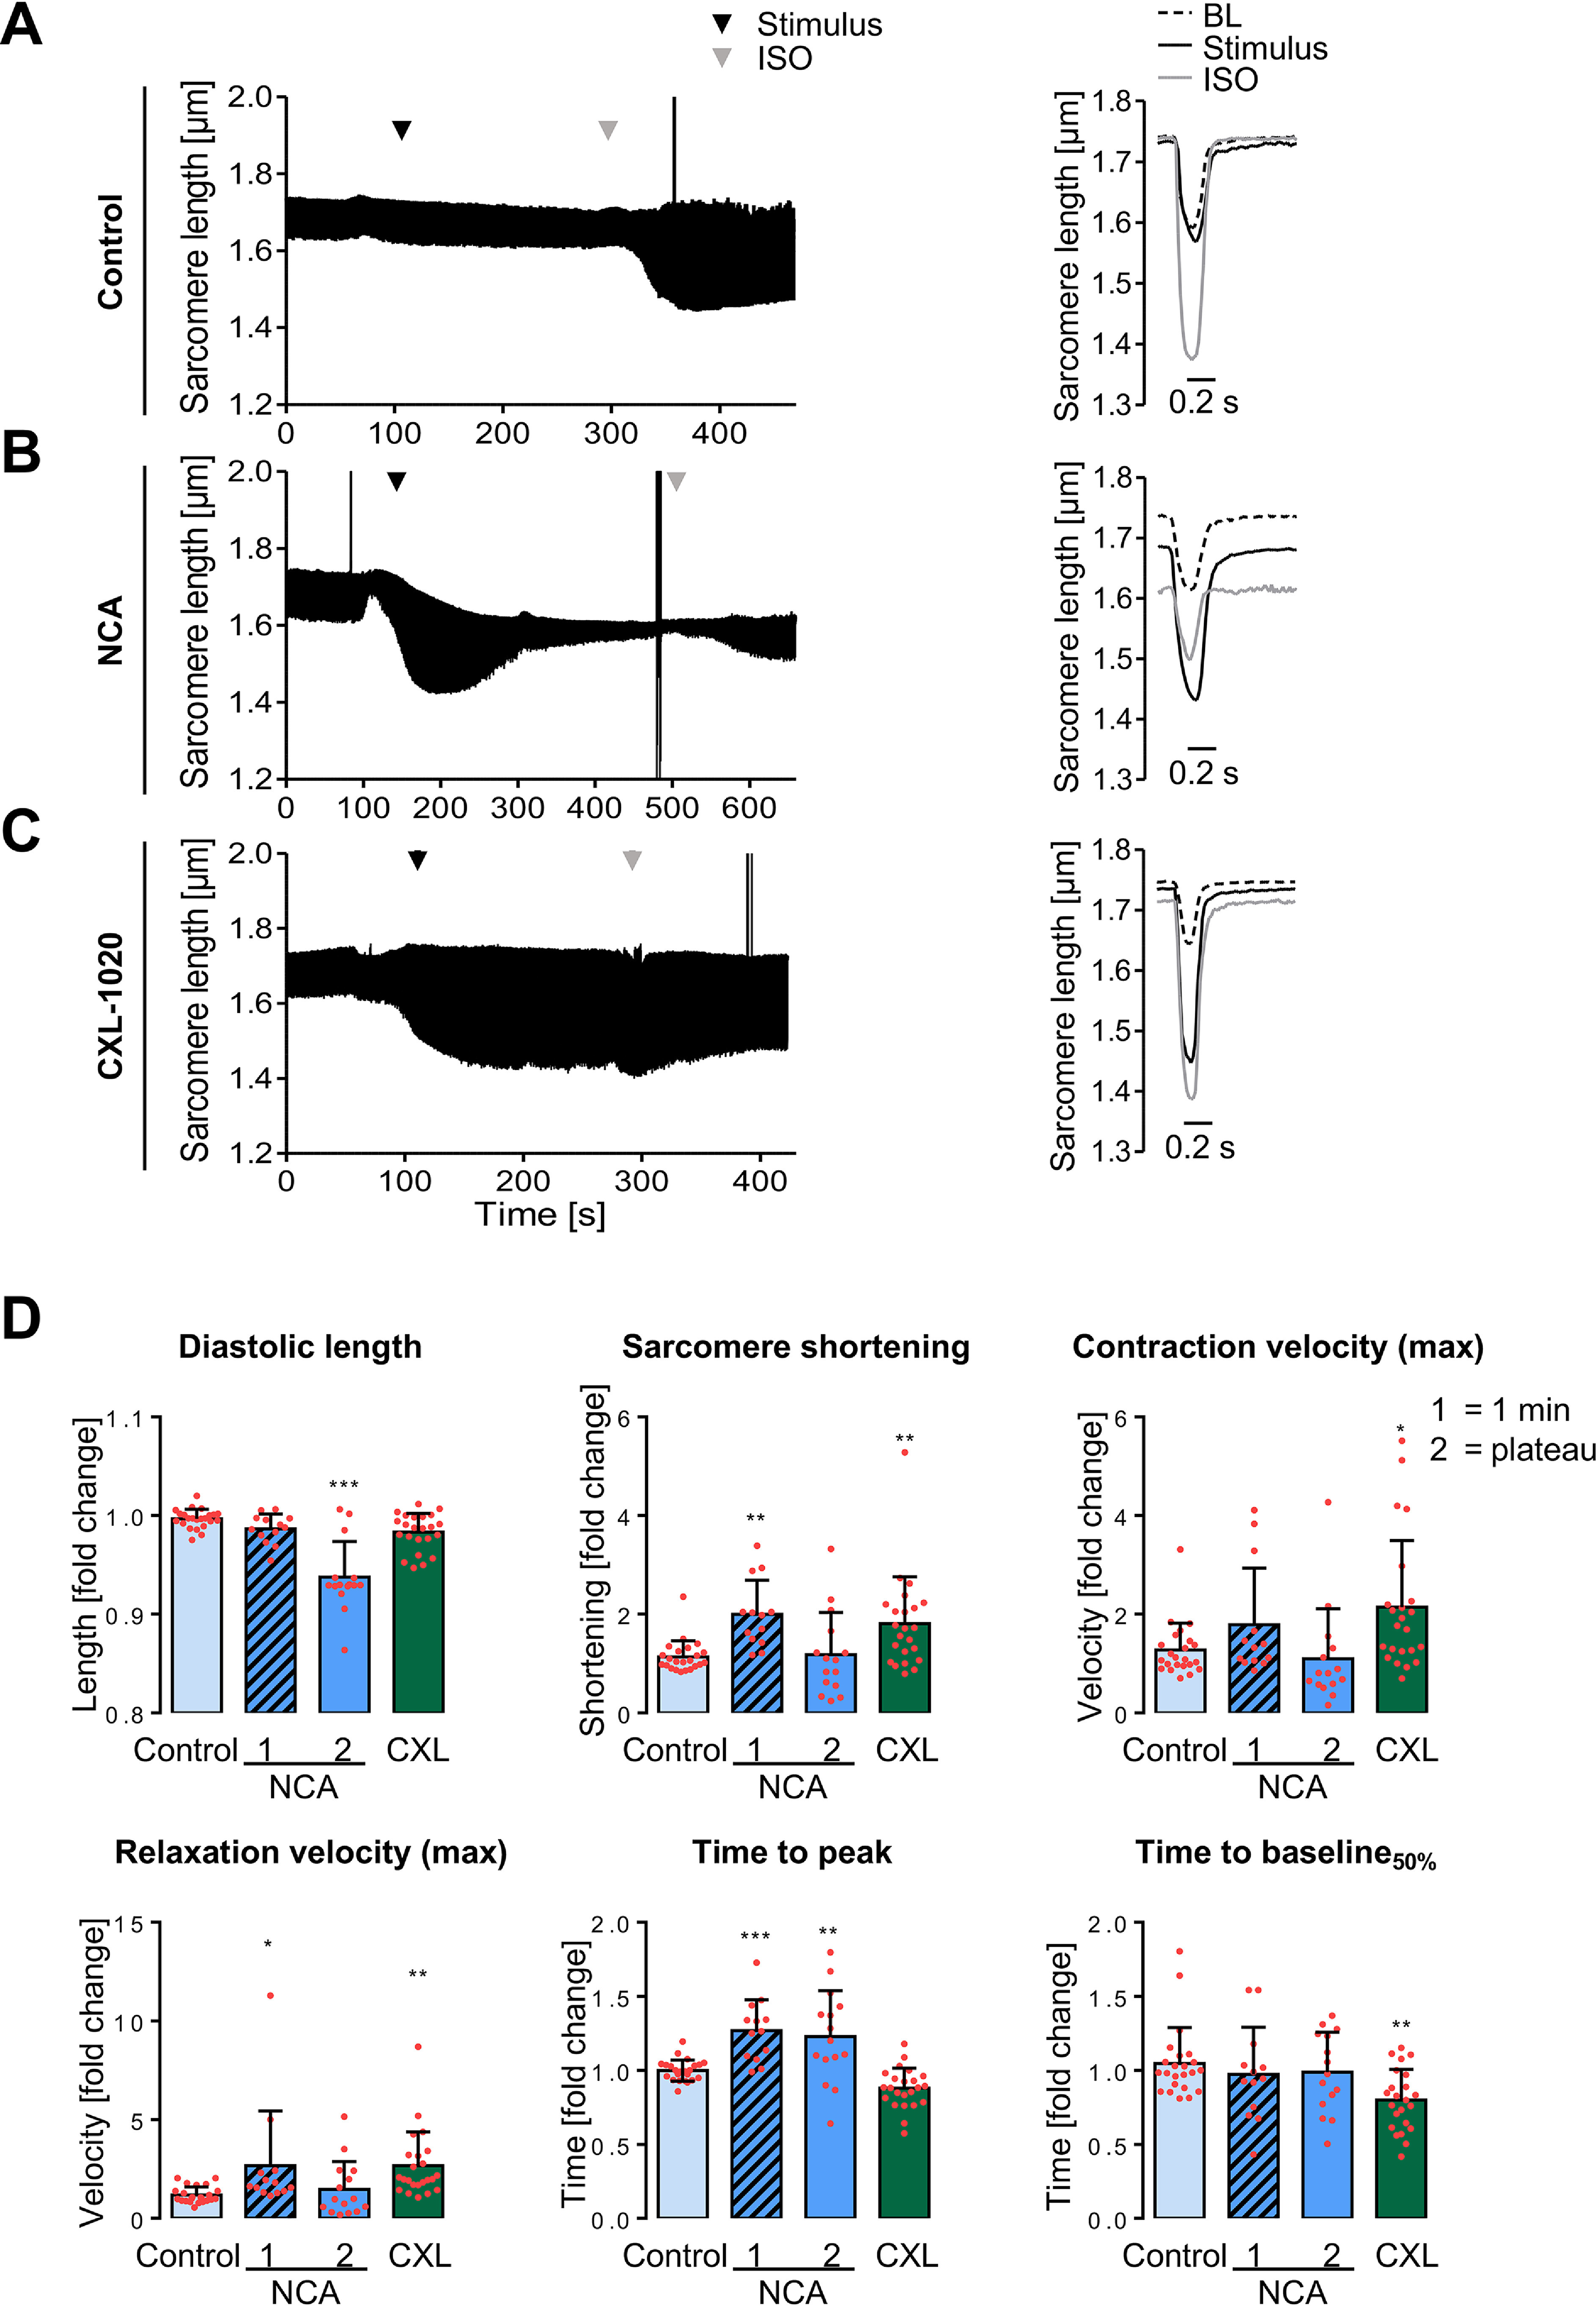
Figure 1.

Impact of NCA and CXL-1020 on ARVM contractility. A–C, examples for contraction traces and corresponding single contraction peaks of single ARVMs paced at 1 Hz. Contraction characteristics were recorded under basal conditions (BL), upon exposure to different stimuli and in response to subsequent ISO application (10 nmol/liter). At baseline, ARVMs were supplemented with (A) vehicle (DMSO; control), (B) NCA (100 µmol/liter), or (C) CXL-1020 (300 µmol/liter). Time points of addition of the respective stimulus (black arrowhead) and ISO (gray arrowhead) are indicated. The single contraction peak shown for NCA represents the contractile response after 1 min of exposure. D, scatter plots compare effects of different stimuli after normalization to BL values from the respective cardiac myocyte and as fold-change of contractile parameters in response to vehicle. Scatter plots include NCA values after 1 min (1) of exposure and at the plateau state (2) of the transient effect (average 4.5 min of exposure). *, p < 0.05; **, p < 0.01; ***, p < 0.001 for comparison with the corresponding vehicle values by one-way ANOVA with Dunnett's post-test (F and p values): a, diastolic length: F = 25.80, p < 0.0001; b, sarcomere shortening: F = 6.08, p < 0.0010; c, contraction velocity (max): F = 4.10, p = 0.0097; d, relaxation velocity (max): F = 4.39, p = 0.0069; e, time to peak: F = 17.77, p < 0.0001; f, time to baseline 50%: F = 4.05, p = 0.0103).
