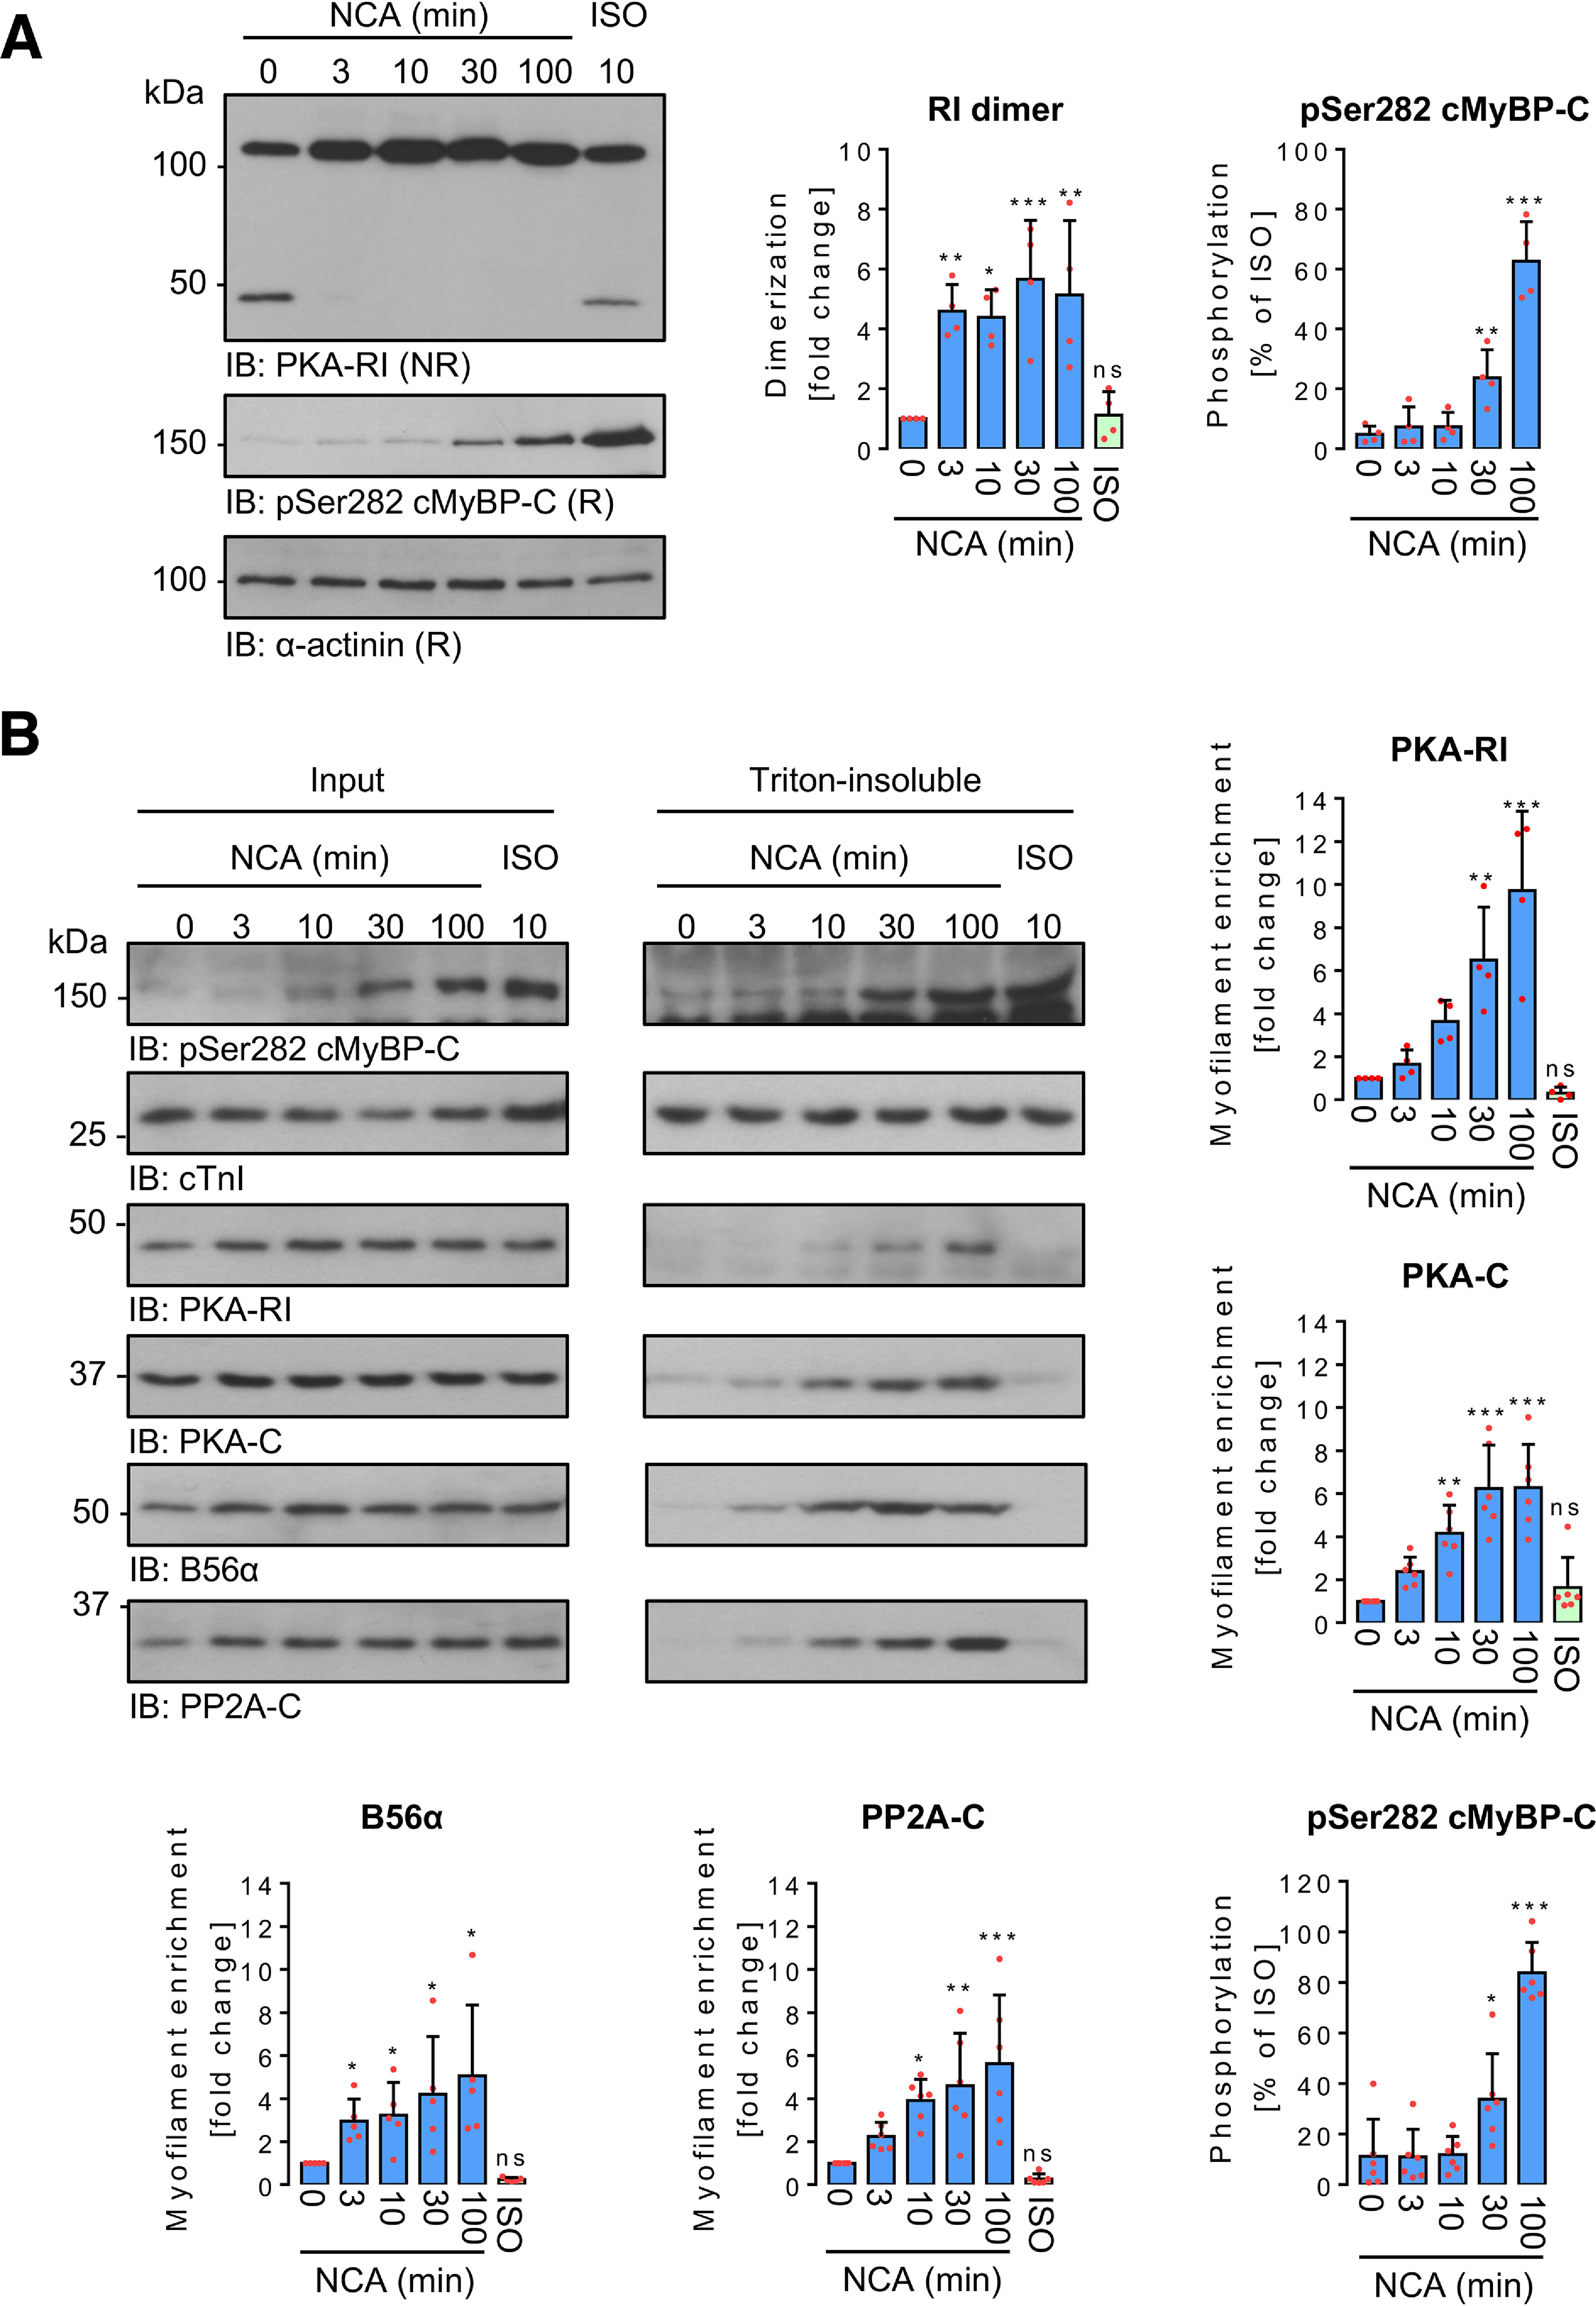
Figure 4.

Time-dependent impact of NCA on PKA-RI dimerization and protein translocation in ARVMs. A, ARVMs were treated with vehicle for 100 min (0 min NCA), NCA (100 µmol/liter) for 3, 10, 30, and 100 min, or ISO (10 nmol/liter) for 10 min. PKA-RI and cMyBP-C phosphorylation at Ser-282 were detected in whole lysates by IB analysis under NR or R conditions, respectively. Scatter plots summarize RI dimer signal fold-change compared with control sample (0 min NCA) and cMyBP-C phosphorylation as % of ISO-response from 4 independent experiments. Band intensities were normalized to α-actinin. *, p < 0.05; **, p < 0.01; ***, p < 0.001 for comparison with vehicle control (0 min NCA) by one-way ANOVA with Dunnett's post-test (RI dimer: F = 8.23, p = 0.0003; pSer-282 cMyBP-C: F = 107.5, p < 0.0001). B, ARVMs were exposed to vehicle for 100 min (0 min NCA), NCA (100 µmol/liter) for 3, 10, 30, and 100 min or ISO (10 nmol/liter) for 10 min and subcellular fractionation was performed under NR conditions. Phosphorylation of cMyBP-C at Ser-282, as well as the presence of PKA-RI, PKA-C, B56α, and PP2A-C were detected in input lysates and Triton-insoluble fractions. Phosphorylation of cMyBP-C at Ser-282 (n = 6) normalized to Coomassie stain signals (not shown) is presented as % of the band intensity induced by ISO. PKA-RI (n = 4), PKA-C (n = 6), B56α (n = 5), and PP2A-C (n = 6) signals from Triton-insoluble fractions normalized to the corresponding inputs are shown as fold-change of the control signal (0 min NCA). *, p < 0.05; **, p < 0.01; ***, p < 0.001 for comparison with the corresponding vehicle control (sample 0 min) by one-way ANOVA with Dunnett's post-test (F and p values): a, PKA-RI, F = 15.18, p < 0.0001; b, PKA-C, F = 15.61, p < 0.0001; c, B56α, F = 4.78, p = 0.0036; d, PP2A-C, F = 9.16, p < 0.0001; e, pSer-282 cMyBP-C, F = 67.33, p < 0.0001). ns, not significant.
