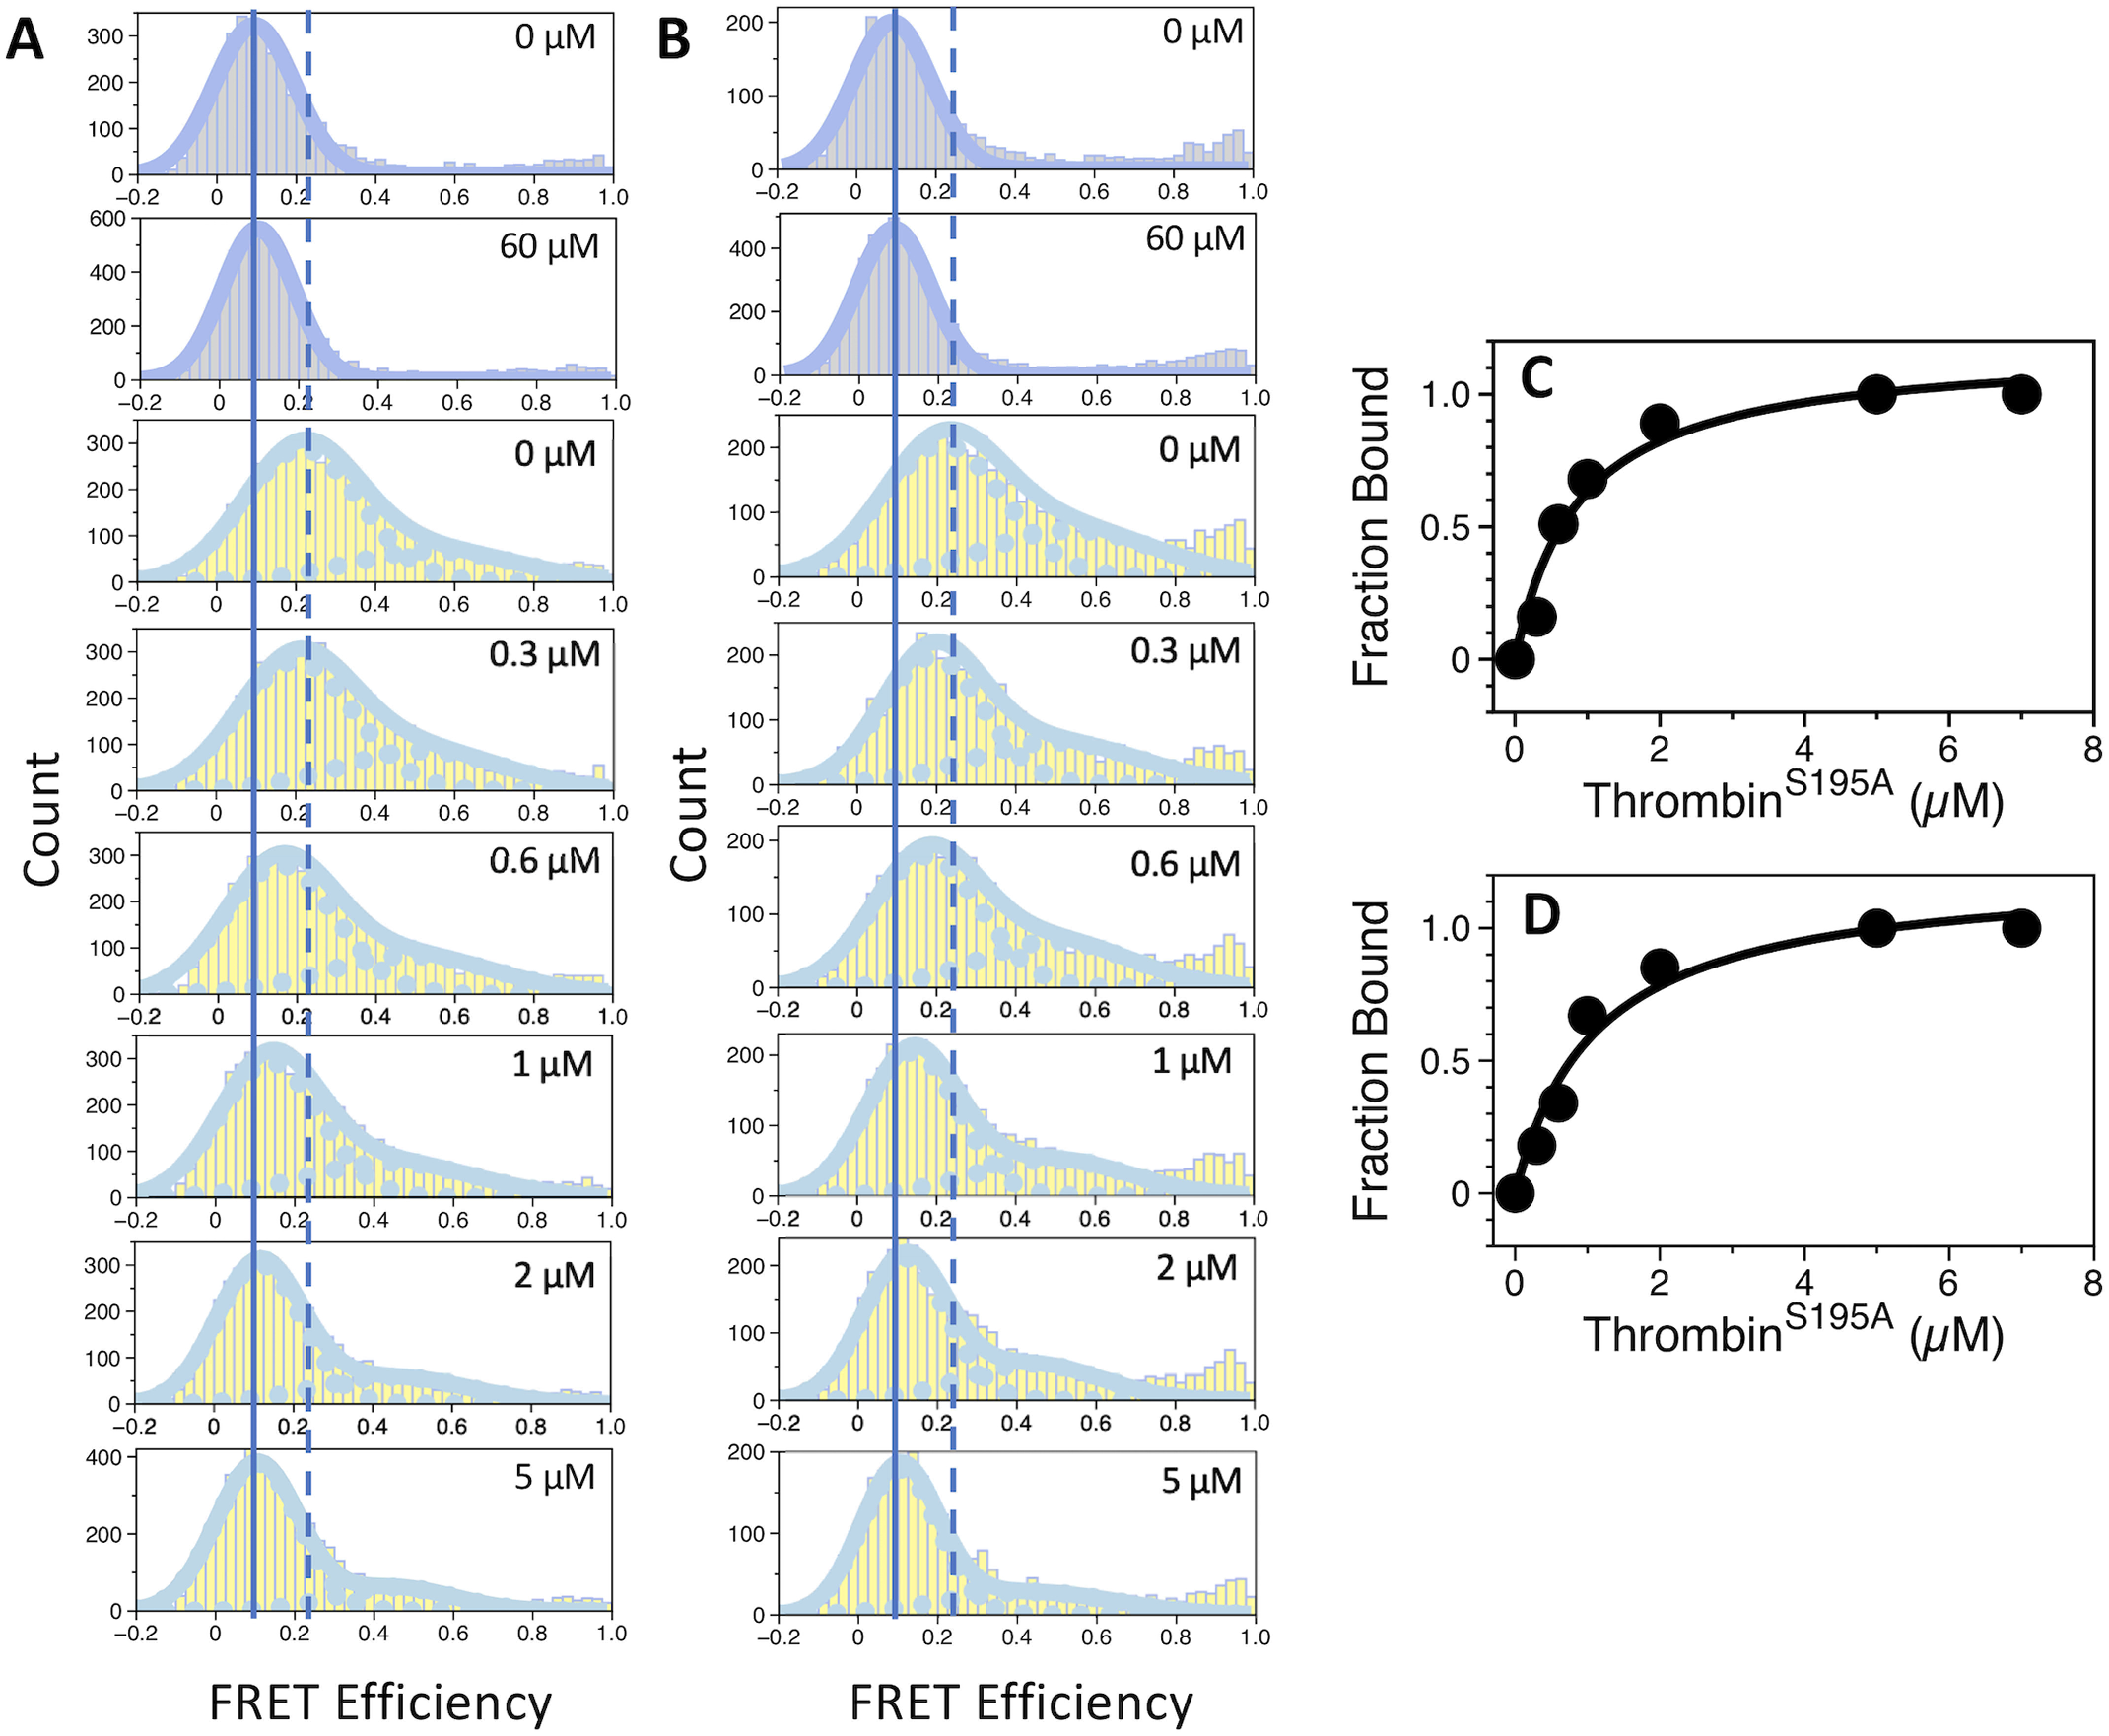
Figure 2.

smFRET profiles of protein C and APC free and bound to thrombin. Shown are the FRET efficiency histograms of (A) protein C and (B) APC. Histograms measured in the presence of 5 mm CaCl2 are displayed in gray, whereas those measured in the presence of 10 mm EDTA are in yellow. The concentration of thrombin is indicated. Continuous and discontinuous vertical lines mark the center of the FRET populations in the absence of thrombin in the presence of CaCl2 or EDTA, respectively. Titrations of protein C (C) and APC (D) with thrombin were measured in the presence of 10 mm EDTA. Binding isotherms were constructed by following the change in the peak center of the low FRET population as a function of thrombin concentration. Fit of the data to a single-site model yields values of Kd equal to 0.86 ± 0.2 μm (protein C) and 1.1 ± 0.2 μm (APC). Experimental conditions are: 20 mm Tris, 145 mm NaCl, 0.02% Tween 20, pH 7.5, with either 5 mm CaCl2 or 10 mm EDTA at 20 °C.
