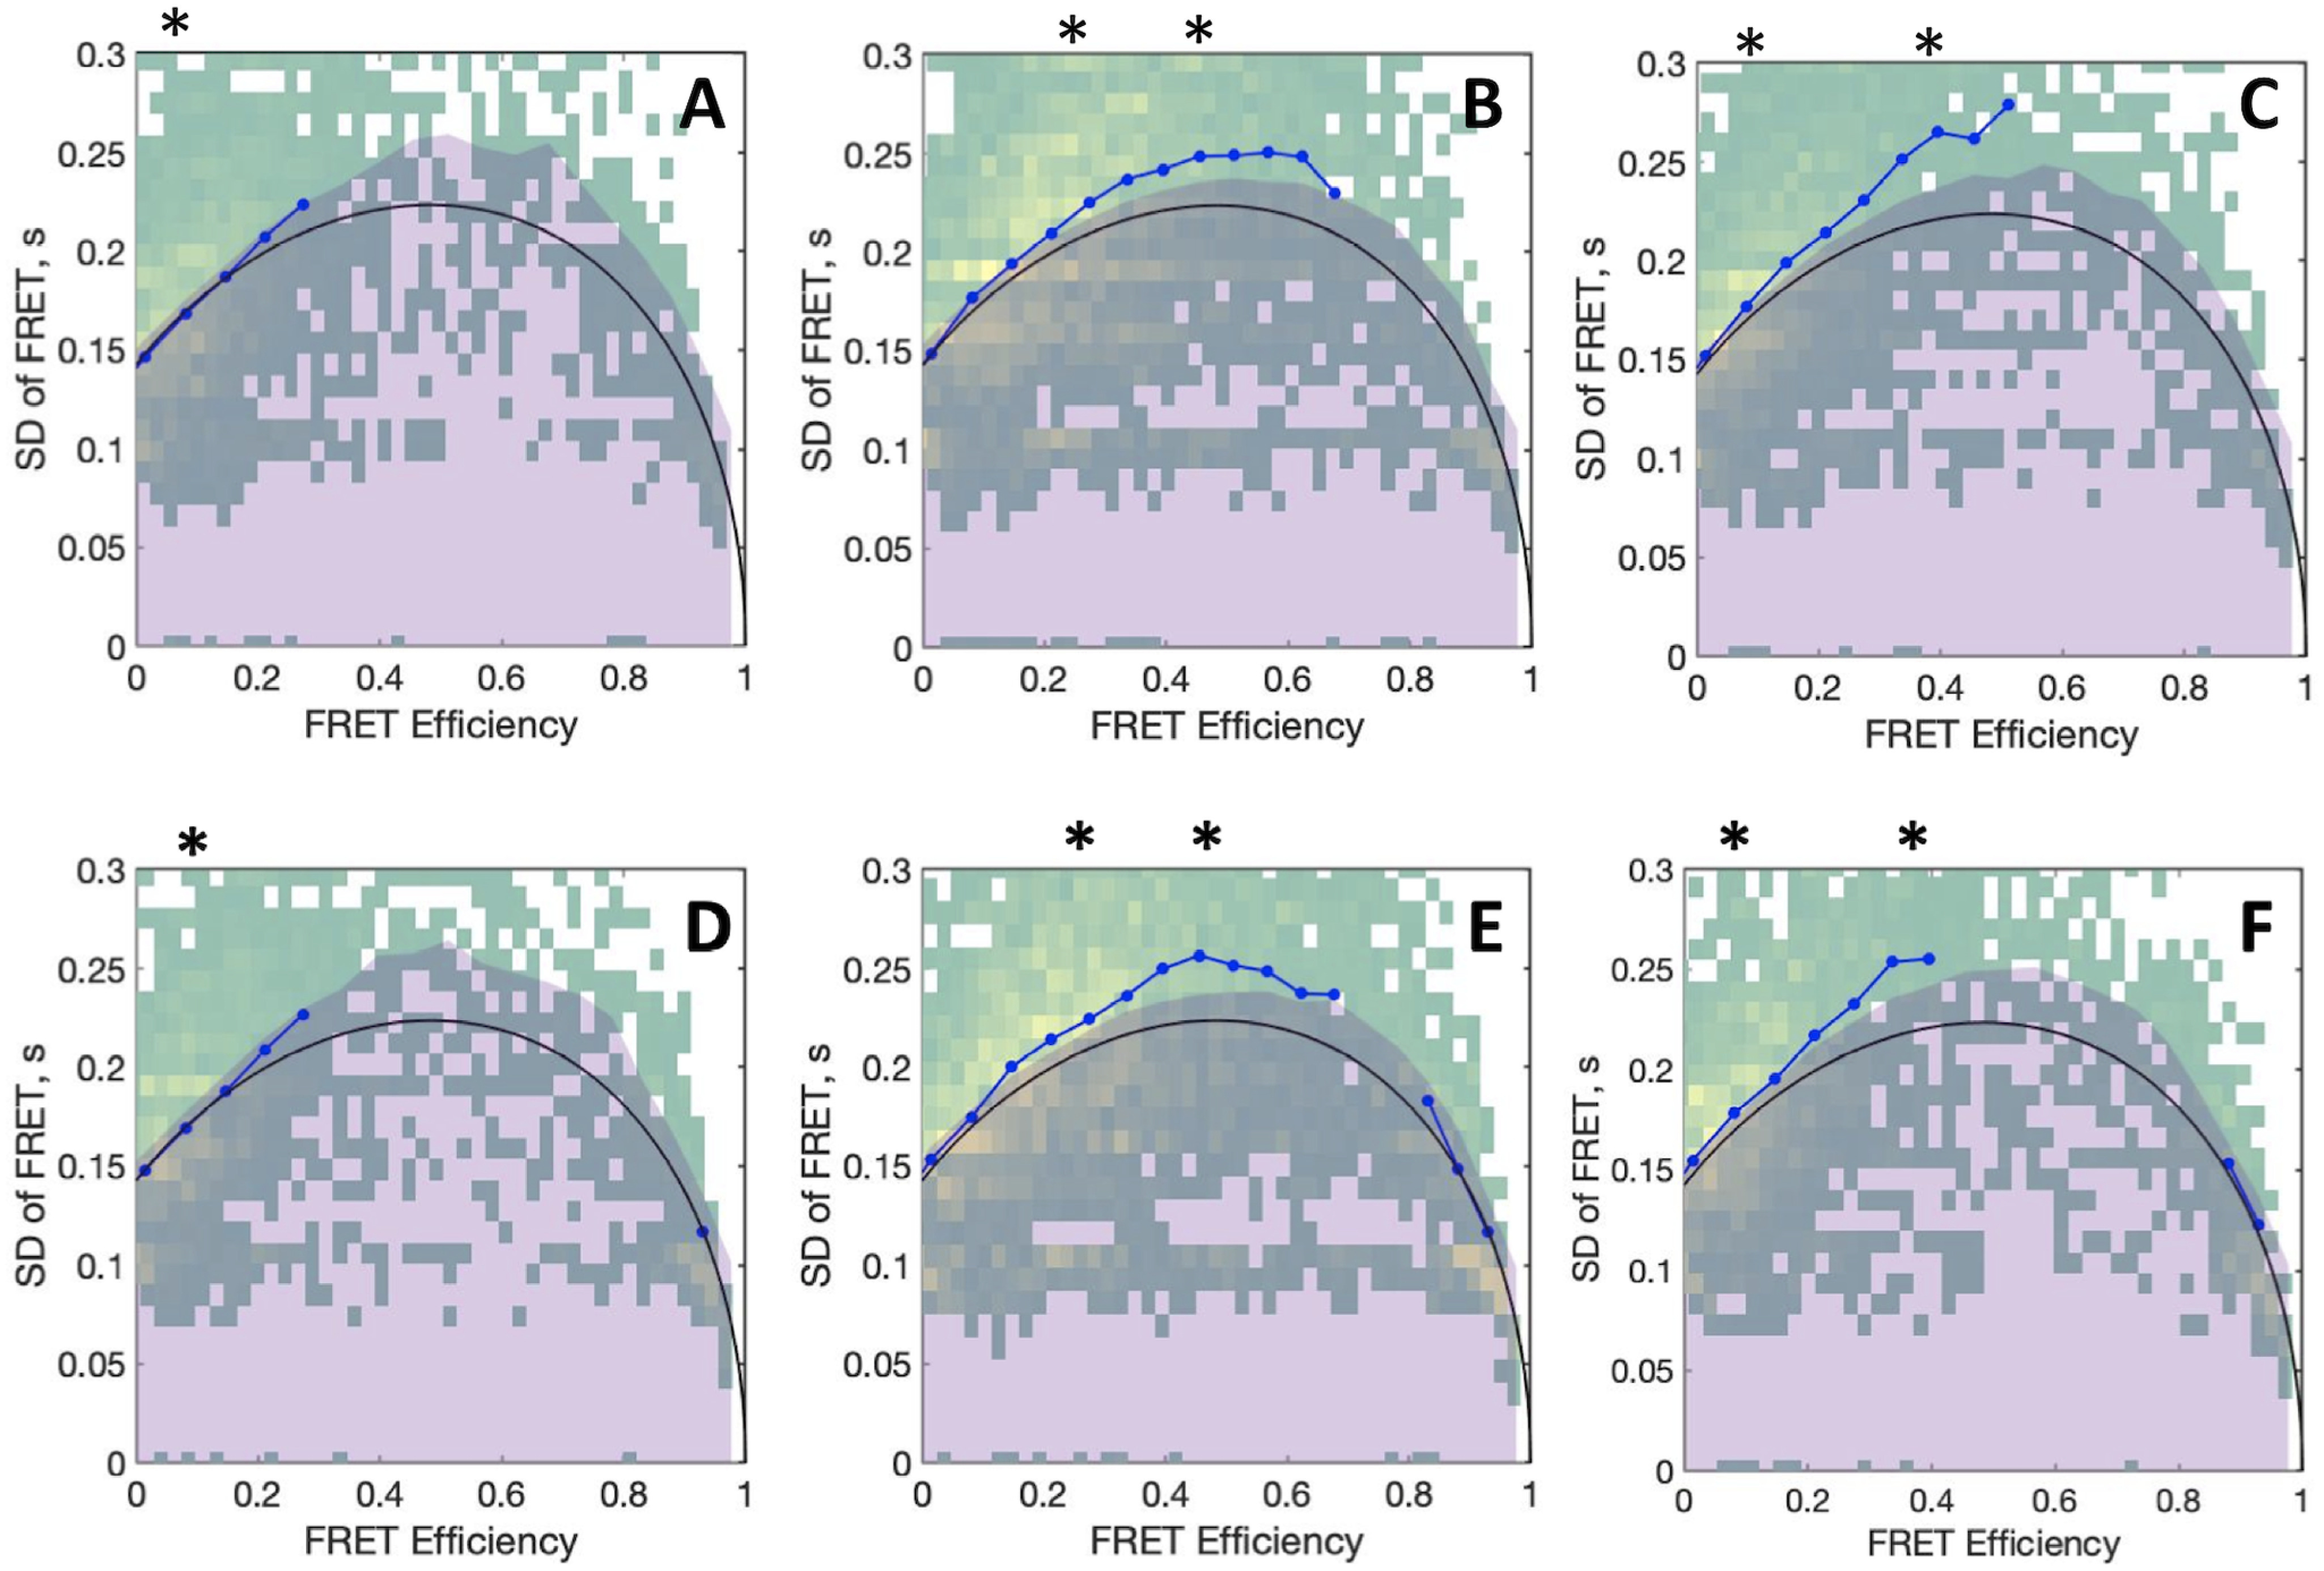
Figure 4.

BVA plots of protein C (upper panels) and APC (lower panels) measured in the presence of 5 mm CaCl2 (A, D) or 10 mm EDTA without (B, E), and with 5 μm thrombin (C, F). Asterisks above each panel denote the FRET population centers obtained from the respective Gaussian fits shown in Fig. 2. In each panel, the expected standard deviation from shot noise is shown as a black line, with its 99.9% confidence interval appearing as a shaded purple area, whereas the observed standard deviation is shown as a blue dotted line. Experimental conditions are: 20 mm Tris, 145 mm NaCl, 0.02% Tween 20, pH 7.5, with either 5 mm CaCl2 or 10 mm EDTA at 20 °C.
