
Figure 6.
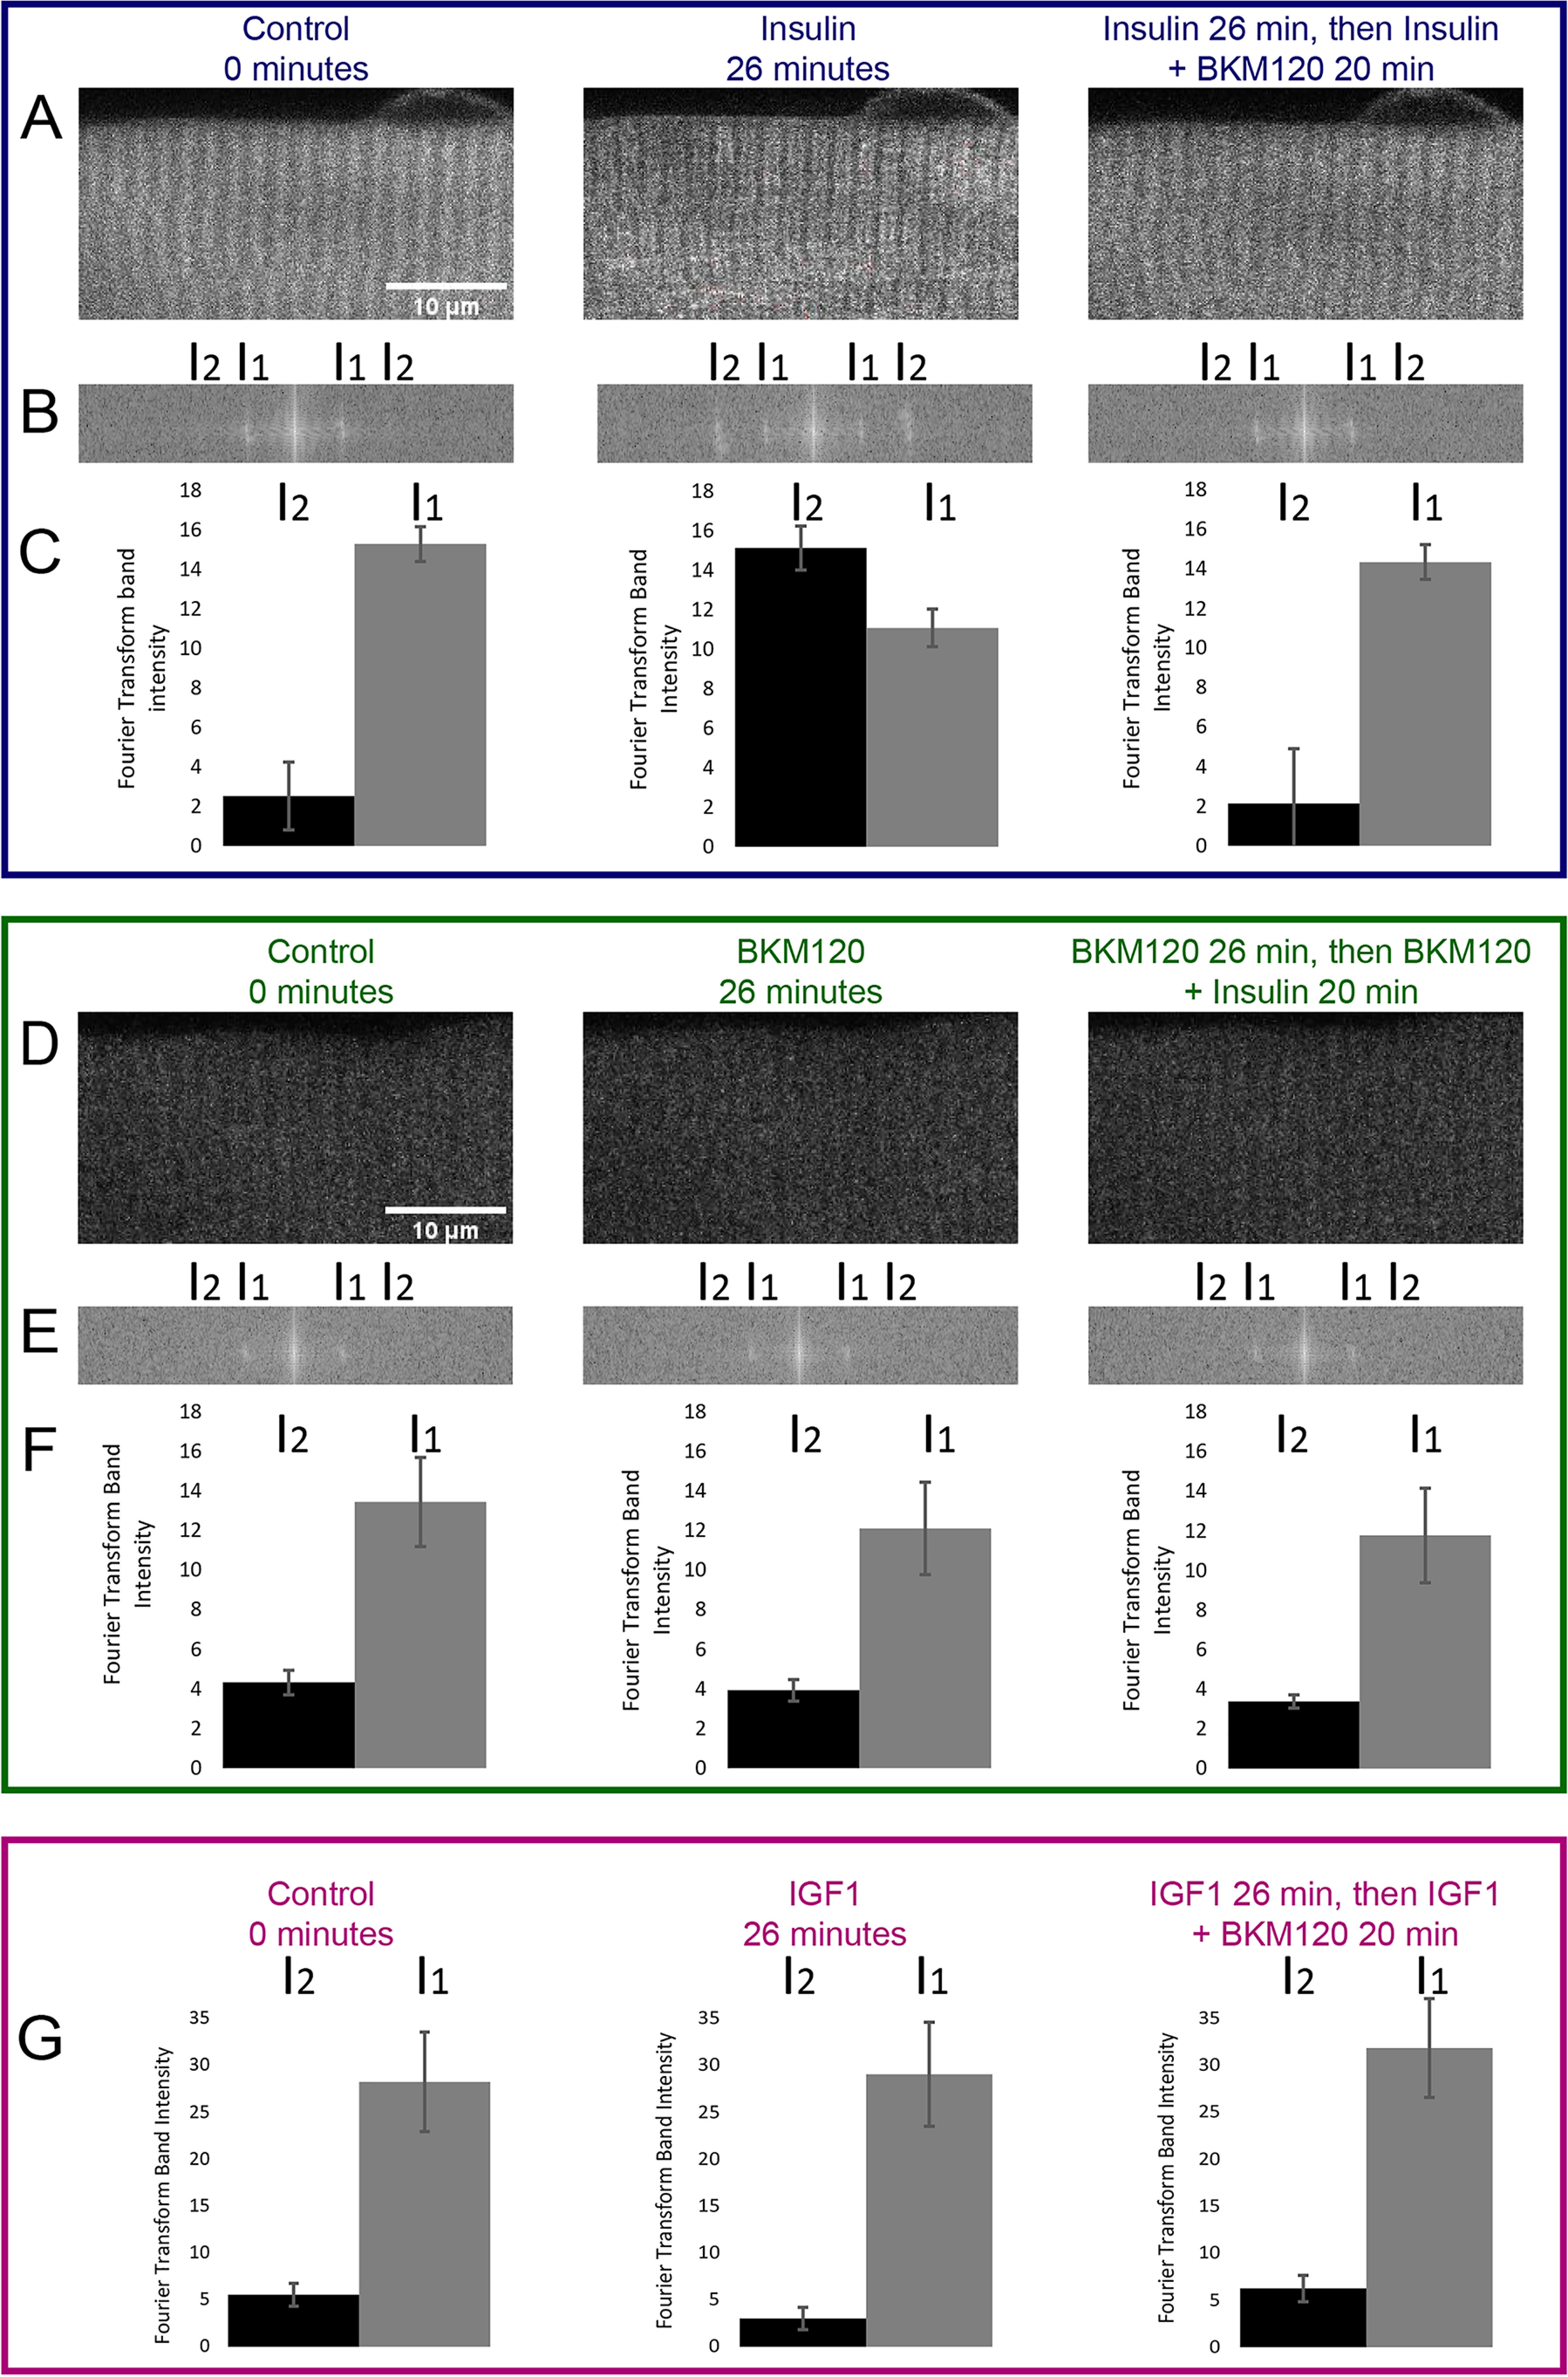
PI3K inhibition blocks insulin effect on subsarcomeric localization of the PIP3 biosensor PH-ARNO-GFP. A and D, fluorescent imaging of PH-ARNO-GFP expressing FDB fibers before treatment (0 min), after initial treatment (insulin or BKM120 for 26 min) or after final treatment (insulin + BKM120 for 20 min). Scale bar shown in 0 min images of A and D apply to the following time point images. In A, a change in PH-ARNO localization is visible from control to insulin treatment to insulin + BKM120 treatment. In D, addition of BKM120 prior to insulin application prevents any translocation of PH-ARNO-GFP. B and E, Fourier transform of images in A and D. The change in PH-ARNO-GFP localization after insulin addition can be visualized via Fourier transform as an increase in intensity at I2. C and F, quantification of Fourier transform band intensity at I1 and I2. Band intensity at I2 changes dramatically in C 20 min after insulin addition; this dramatic change is reversed and blocked with the use of BKM120. G, IGF1 has no effect on PH-ARNO-GFP localization. Shown is the quantification of Fourier transforms done on images of PH-ARNO-GFP electroporated FDB fibers imaged before treatment (0 min), after initial treatment with IGF1 (IGF for 26 min) or after treatment with IGF1 and BKM120 (IGF + BKM120 for 20 min). Band intensity at I1 or I2 does not change upon IGF1 addition.