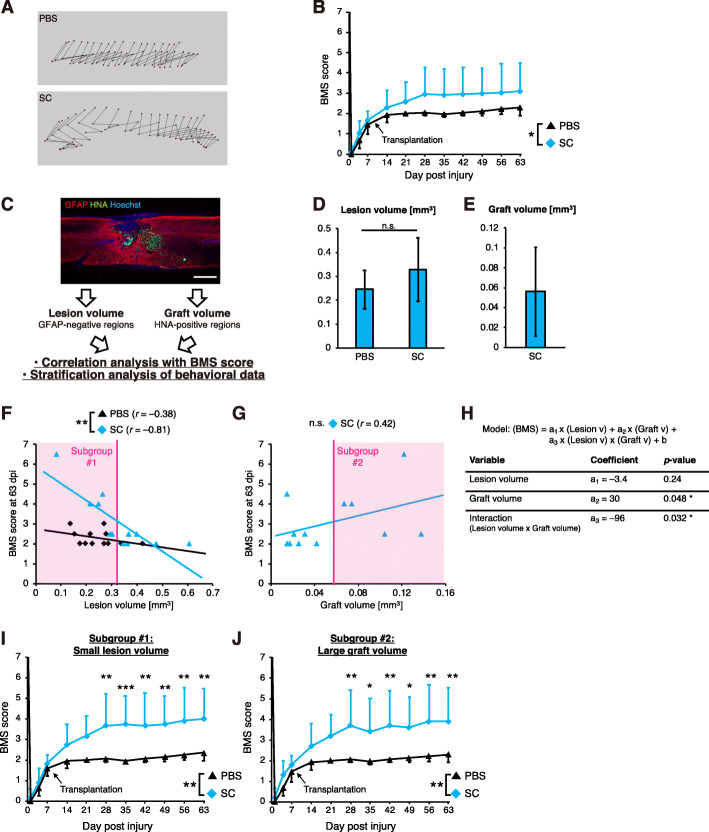
Fig. 3.
Motor function recovery in stratified subgroups. a Representative trajectories of hindlimb motions at 9 weeks after injury. b BMS scores of the mice transplanted with SC-type NPCs (the SC group) and the control mice (the PBS group) (SC group, n = 12; PBS group, n = 12; mean ± SD; *p < 0.05; two-way repeated measures ANOVA). c Histological parameter analysis. The lesion volume, graft volume, and spinal cord area at the lesion epicenter were assessed by the staining of sagittal sections of injured spinal cords with anti-GFAP and anti-HNA antibodies. Scale bar, 500 μm. d, e Quantification of the lesion volume (d) and the graft volume (e) (SC group, n = 12; PBS group, n = 12; mean ± SD; n.s., not significant; Student’s t test). f, g Correlation analysis of each parameter [the lesion volume (g) and the graft volume (h)] and the BMS score at 9 weeks after injury. The Pearson correlation coefficient r is shown. Statistical significance was assessed by regression models (**p < 0.01; n.s., not significant; multiple linear regression in F; single linear regression in G). The k-means-based unbiasedly selected subgroups for the stratification analysis are indicated as red boxes. h Multivariable regression analysis of BMS scores at 63 dpi in the grafted group (*p < 0.05). i, j BMS scores of selected cohorts according to the lesion volume (I) and the graft volume (j) (Subgroup #1: SC group, n = 6; PBS group, n = 10. Subgroup #2: SC group, n = 5; PBS group, n = 12 (the original cohort). mean ± SD; ***p < 0.001, **p < 0.01, *p < 0.05; two-way repeated measures ANOVA followed by a post hoc Tukey’s test. Subgroup #2 was compared to the PBS group in the original cohort

