Fig. 2.
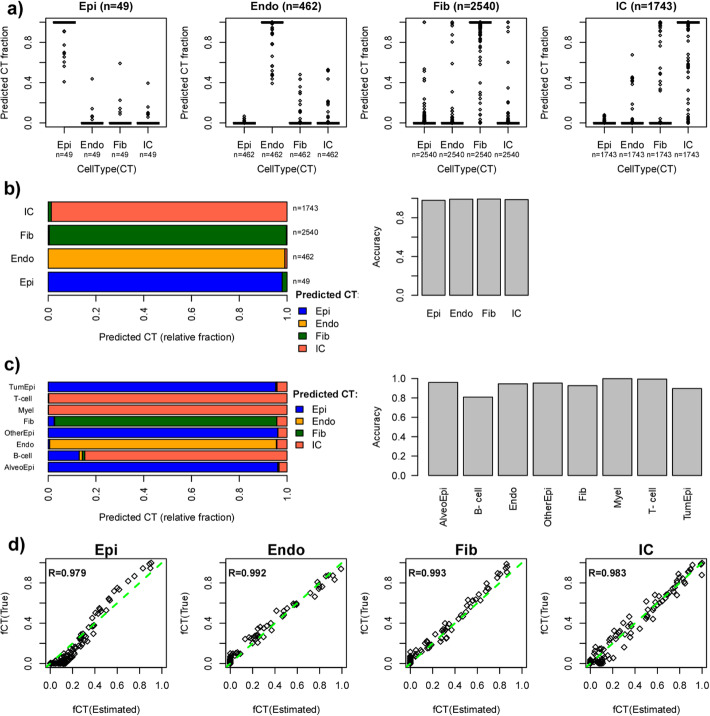
Validation of lung tissue scRNA-Seq reference matrix. a Boxplots of estimated cell type fractions for single-cells from the lung MCA1 10X atlas, which were annotated as epithelial (Epi), endothelial (Endo), fibroblast (Fib), and immune cell (IC). The number of single cells annotated to each cell type is given. Cell type fractions were estimated using RPC with an expression reference defined over 4 cell types (epithelial, endothelial, fibroblast, and immune cell) using the SmartSeq2 scRNA-Seq data from MCA1. b Left: Barplots depicting the relative fractions of single-cells annotated to each single-cluster (labeled on y-axis) which were predicted to be epithelial, endothelial, fibroblast, or immune cell (labeled by different colors) based on the cell type fraction estimates obtained in a. Right: Barplot displaying the overall accuracy of using RPC+expression reference to correctly classify each single-cell type. c As b, but now for using RPC+expression reference on the 10X human data from Lambrecht et al. and for a total 8 cell types as determined in that study. d Scatterplots of the true cell type fractions (y-axis) vs. the estimated cell type fractions (x-axis) in Lambrecht et al. data as obtained via RPC+expression reference on simulated bulk lung tissue samples, generated via in silico mixtures of 1000 single cells. Mixtures were generated from all 8 cell types as shown in c, and estimated cell type fractions were obtained for total epithelial, endothelial, fibroblast, and immune cell fractions, as shown

