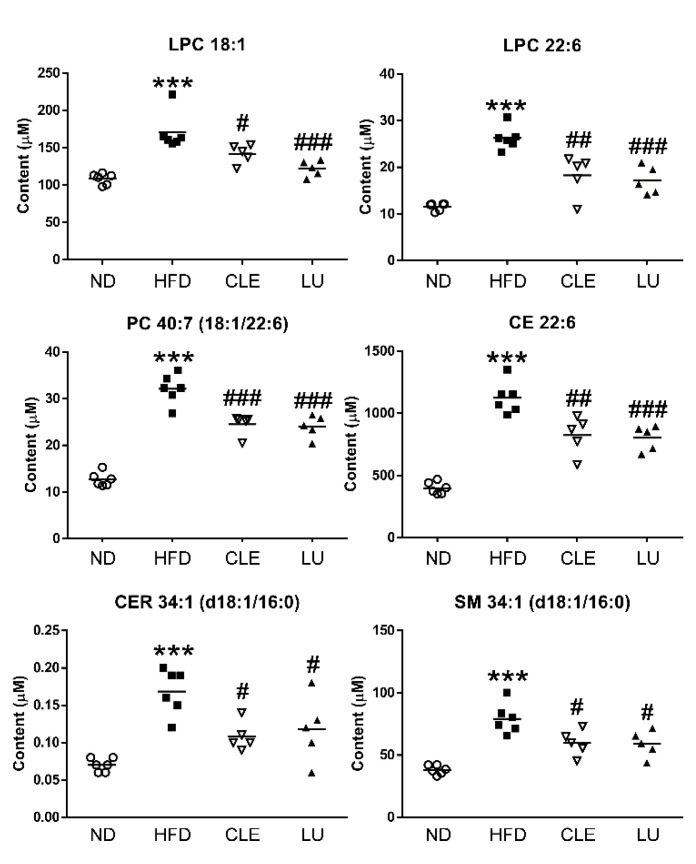
Figure 6.
Scatter plot showing significant differences in the levels of the lipid biomarkers with the same lipid compositions among the normal diet (ND), high-fat diet (HFD), HFD plus Chrysanthemum morifolium Ramat leaf extract 1.5% diet (HFD + CLE), and HFD plus luteolin 0.003% diet (HFD + LU) groups. Each symbol represents an individual mouse (Circle (○): ND; Box (■): HFD; Inverted triangle (▽): CLE; Triangle (▲): LU; Diamond (◆): Quality control (QC)). *, # different letters indicate significant difference compared with the normal diet (ND) group (*) and the HFD group (#), as determined by Tukey’s multiple comparisons test. (*** p < 0.001, # p < 0.05, ## p < 0.01, ### p < 0.001). LPC: lysophosphatidylcholine; PC: phosphatidylcholine; CE: cholesteryl ester; CER: ceramide; SM: sphingomyelin.

