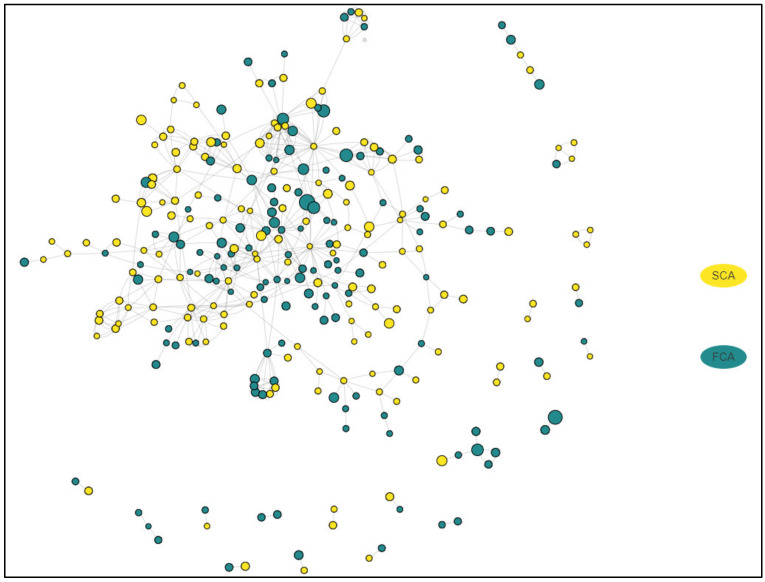
Figure 3.
Interactive network representing the relations between all DEGs in functioning (FCA) and silent (SCA) corticotroph adenomas. The figure shows a representation of the complexity of the results and the interactions that are present. An interactive version of this figure is presented at https://alexeie.github.io/corticotroph-adenomas/. Detailed information on all the key interactions in the dataset, including the involved genes and the known relationships between them, can be accessed via the link. Genes higher expressed in FCA group are green; genes higher expressed in SCA are yellow. The size of the round circles is proportional to the log2 fold change.

