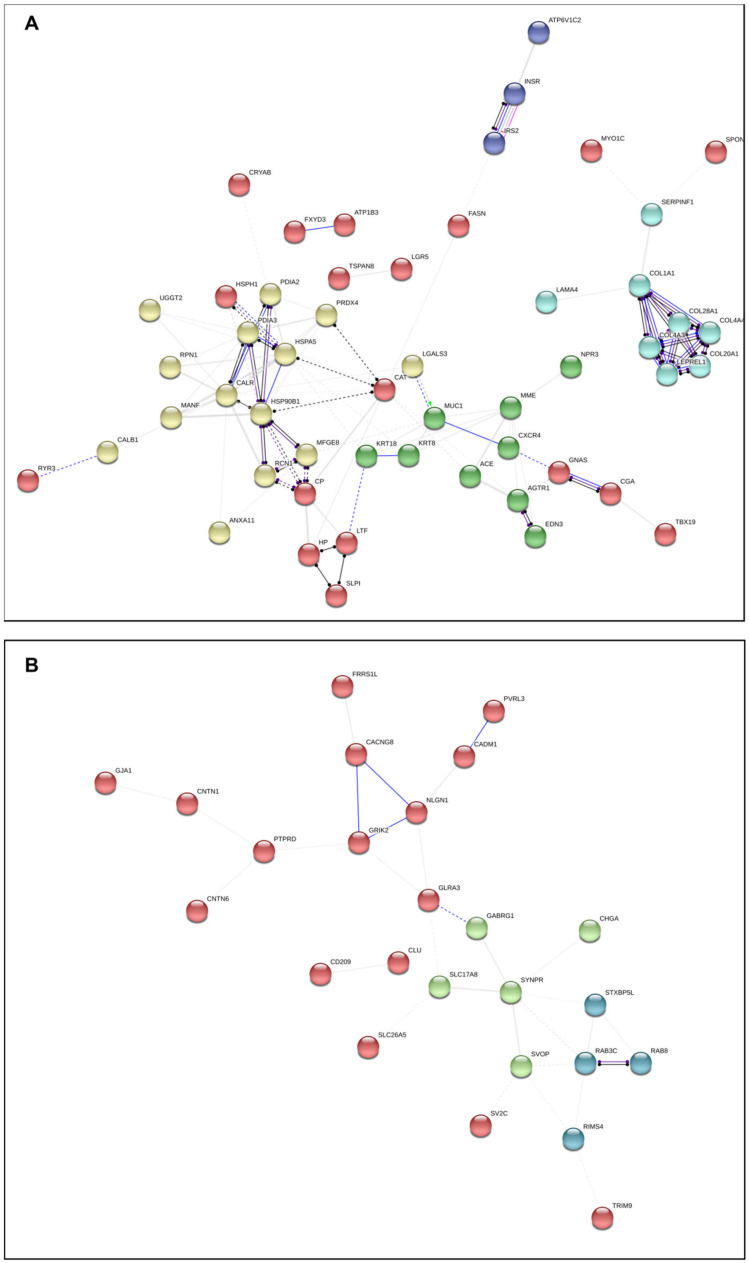
Figure 4.
Network analysis presenting DEG interactions in functioning (FCA) (A) and silent (SCA) (B) corticotroph adenomas based on selected distinct biological processes and cellular components overrepresented in FCA and SCA. GO processes representative of the pituitary tumor phenotype or involved in hormone production/secretion and tumor growth were selected to be presented in the figure. For a comprehensive list of all the significant processes in the overrepresentation test and the selected ones, please see Supplementary File S1 (biological_process_SEQ, cellular_component_SEQ, GO selected_SEQ and GO matches_SEQ) and the online figure for FCA at https://version-11-0.string-db.org/cgi/network.pl?networkId=6sMwLJjOC4ua and for SCA at https://version-11-0.string-db.org/cgi/network.pl?networkId=pdN7O6hmQ5G3. The color of the circles indicates the result of a K-means algorithm for identifying clusters of genes according to their interaction partners.

