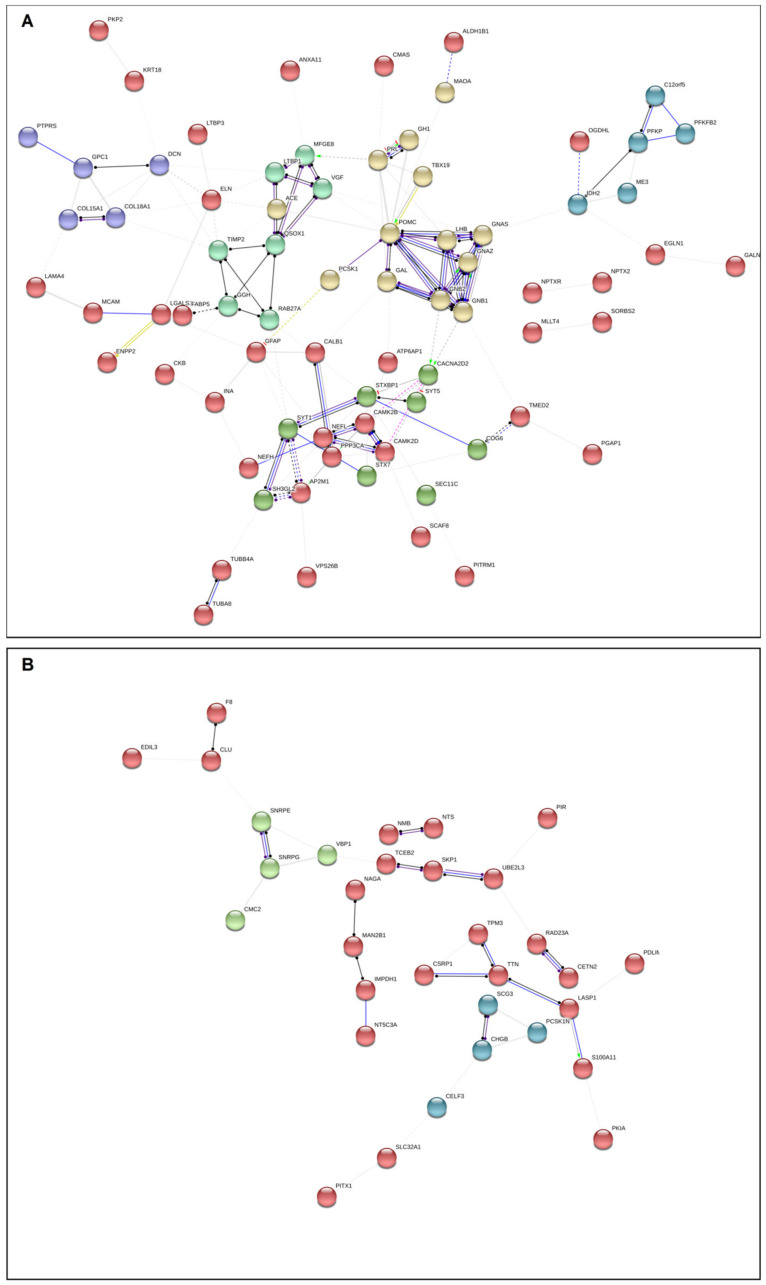
Figure 5.
Network analysis presenting all DEP interactions in functioning (FCA) (A) and silent (SCA) (B) corticotroph adenomas. See Supplementary File S1 GO_matches_MS2 and online figures for FCA https://version-11-0.string-db.org/cgi/network.pl?networkId=nBtGbCu86iDj and for SCA https://version-11-0.string-db.org/cgi/network.pl?networkId=eC3B7NayyvdC for more detailed information. The color of the circles indicates the result of a K-means algorithm for identifying clusters of genes according to their interaction partners.

