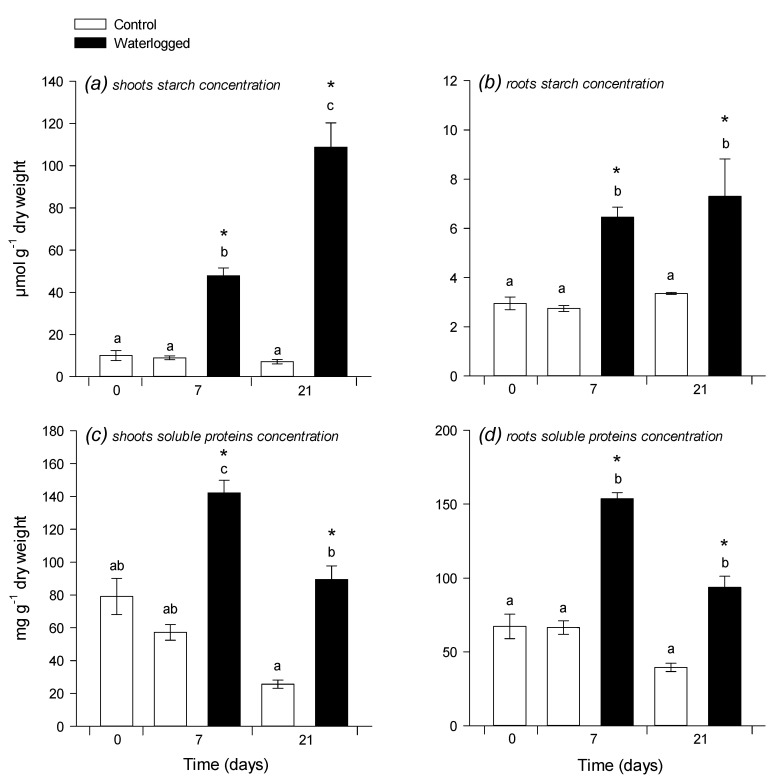
Figure 3.
Starch and soluble protein concentrations. Starch content (in µmol hexose equivalents g−1 DW) in shoots (a) and roots (b) and soluble proteins concentration (in mg g−1 DW) in shoots (c) and roots (d) 7 and 21 days after the beginning of waterlogging. Same legend as in Figure 1. Data are means ± SE (n = 3).

