Figure 5.
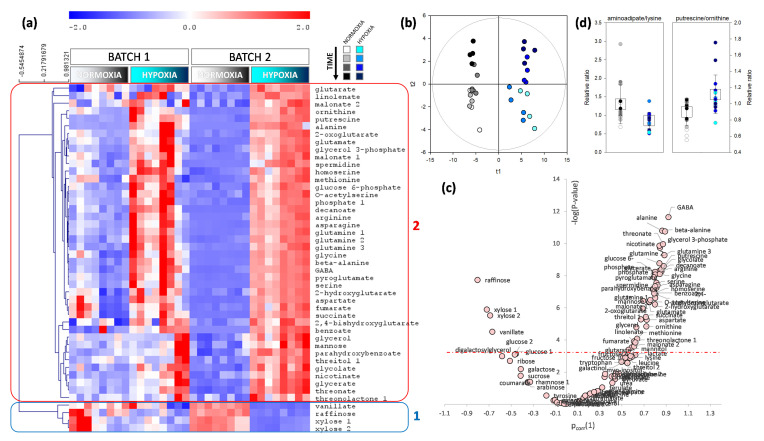
Metabolomics pattern of roots under control (normoxia) or waterlogging (hypoxia) conditions (grey and blue shades, respectively). (a) Heat map showing significant metabolites (p < 0.0005, i.e. Bonferroni threshold; two-way ANOVA) with a hierarchical clustering on left (Pearson correlation). The two main groups are framed and numbered (group 1 framed in blue: metabolites decreasing under waterlogging; group 2 framed in red: metabolites increasing under waterlogging). (b) Score plot of the multivariate analysis by O2PLS demonstrating the very good sample discrimination. (c) Volcano plot showing best discriminating metabolites (control vs. waterlogging) with the p-value (y-axis) and the loading in the O2PLS (x-axis). The horizontal dash-dotted line represents the Bonferroni threshold (0.0005). The two best discriminating features under waterlogging are an increase in γ-aminobutyrate (GABA) and a decrease in raffinose. (d) Relative metabolic ratios: aminoadipate-to-lysine (left) and putrescine-to-ornithine (right). For both, the difference between waterlogging and control conditions is significant (p < 0.01, Welch).

