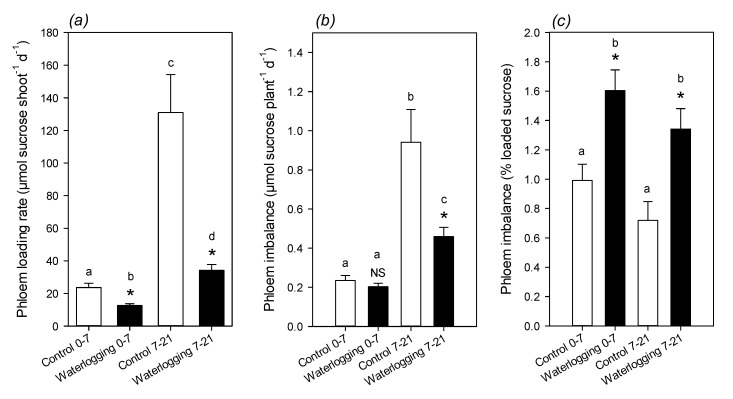
Figure 7.
Calculated sucrose phloem loading rate and imbalance using mass-balance between shoots and roots: (a) average loading rate during for the two time windows considered (0 to 7 d, and 7 to 21 d) in µmol sucrose shoot−1 day−1; (b) imbalance (difference between loading by shoots and unloading by roots) in µmol sucrose plant−1 day−1; (c) imbalance expressed in percentage of loaded sucrose. Letters stand for significantly different classes in one-way ANOVA and asterisks stand for statistical significance (Welch test) between control and waterlogging. NS, non-significant. See Supplementary Material for calculation details.

