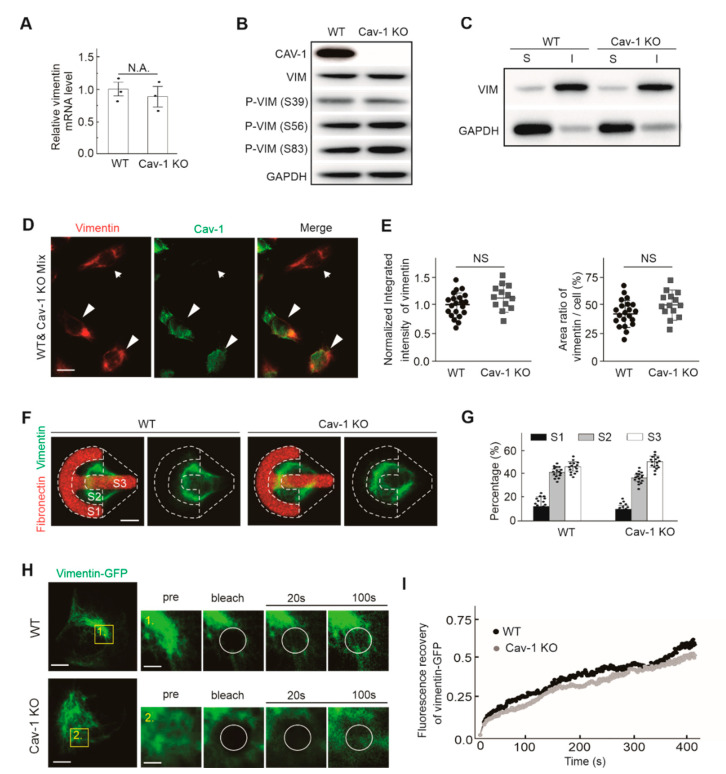
Figure 3.
Knockout of Cav-1 had no effect on the expression, phosphorylation, distribution, soluble/insoluble ratio, and dynamics of vimentin in U2OS cells. (A) Quantitative RT-PCR (qRT-PCR) analyzed vimentin mRNA levels in wild-type (WT) and Cav-1-knockout (Cav-1 KO) cells. The data was from three independent experiments indicated by black dots. N.A. indicated that the difference between two groups are not significance. (B) The extracts of U2OS cells with wild-type and Cav-1-knockout were subjected to Western blot analysis to detect levels of total- and phosphorylated- vimentin. (C) Soluble (S) and insoluble (I) extracts of vimentin from wild-type and Cav-1-knockout cells were subjected to Western blot analysis. (D) Wild-type and Cav-1-knockout cells were mixed, seeded in the same cover glasses, and stained for immunofluorescence. Representative images showed the subcellular distribution of endogenous vimentin and Cav-1. White arrows indicated Cav-1-knockout cells and white arrowheads indicated wild-type cells. Bars, 50 µm. (E) The quantification of vimentin signals in immunofluorescence images. The panel on the left showed normalized relative fluorescent intensities in wild-type and Cav-1-knockout cells. It was shown the quantification of normalized relative fluorescence intensities in wild-type (n = 21) and Cav-1-knockout cells (n = 13). The panel on the right showed the ratio of vimentin area relative to the cell area. It was shown the ratio of vimentin area in wild-type (n = 21) and Cav-1-knockout cells (n = 14). (F) Localization of the vimentin network in wild-type or Cav-1-knockout cells grown on the fibronectin coated crossbow micropatterns. Cells were divided into three segments S1, S2, and S3 (white dotted outline marked) from the leading edge (left) to the cell rear (right). Bars, 10 µm. (G) Percentage distribution of fluorescent signals in segments S1, S2, and S3 in wild-type and Cav-1-knockout cells. It was shown the vimentin distribution in wild-type (n = 16) and Cav-1-knockout cells (n = 16). (H) Representative examples of vimentin-GFP dynamics in wild-type and Cav-1-knockout cells as examined by FRAP. Magnified images showed in the yellow box of the left panels. White circles indicated the photo bleaching regions. Bars, 10 µm in the left panels and 2 µm in the right magnified panels, respectively. (I) Averaged recovery curves of the raw FRAP data. The quantified data were presented as mean ± s.e.m. N.S. indicated that the difference between two groups are not significance.

