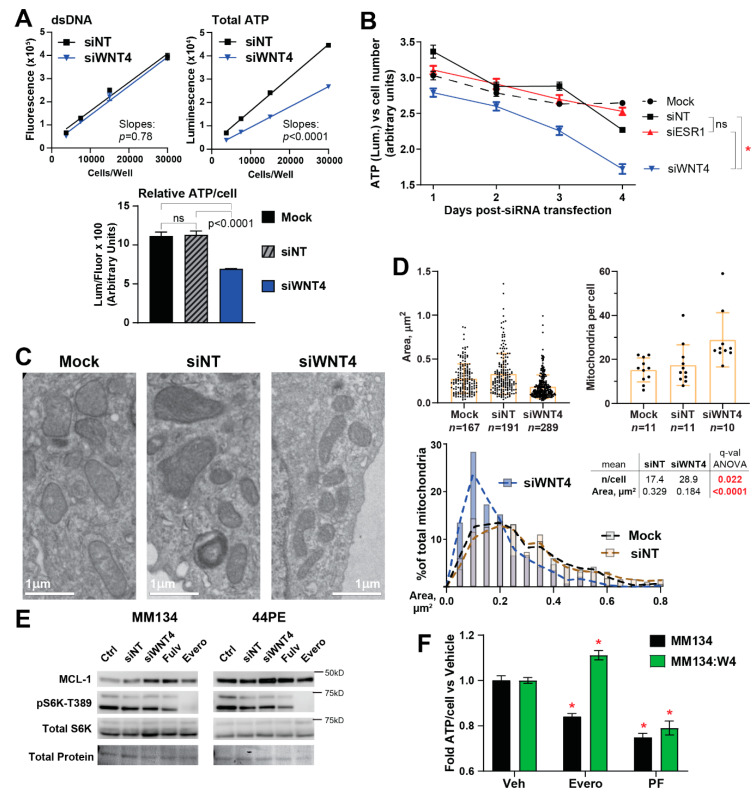
Figure 4.
WNT4 knockdown compromises cellular metabolism and drives mitochondrial fragmentation. (A) MM134 cells were transfected with siRNA as indicated, 48 h later cells were harvested and re-plated in a two-fold serial dilution in technical quadruplicate. Then, 24 h later (72 h post-transfection) dsDNA and total ATP were quantified from separate samples. Bar graph at bottom represents 30 k/well data from standard curves (mock excluded from standard curves for clarity). Comparisons with ANOVA + Tukey correction. (B) MM134 cells transfected as indicated, with dsDNA and total ATP quantified at the indicated time from matched samples. Cell number was determined by interpolating dsDNA fluorescence vs. a standard curve, and total ATP (luminescence) was normalized vs. cell number. Comparisons by two-way ANOVA; α = 0.01. * p < 0.0001. (C) MM134 cells were fixed for transmission electron microscopy 72 h post-transfection. Representative images of mitochondrial morphology shown. (D), Mitochondrial dimensions were quantified from TEM images using ImageJ (see Section 4). Box-and-whiskers represent mean ± SD. Histogram is derived from area data shown as dot plot at top. (E) Cells in full serum were either reverse transfected with the indicated siRNA for 48 h, or treated with 100 nM fulvestrant, or 100 nM everolimus for 24 h. S6K phosphorylation (mTOR target site T389) shown as positive control for mTOR inhibition by everolimus. Total protein detected with Ponceau staining. (F) MM134 were treated with 100 nM everolimus or 30 µM PF-4708671 for 72 h; ATP and dsDNA were quantified as above. * q < 0.05 vs. vehicle by two-way ANOVA.

