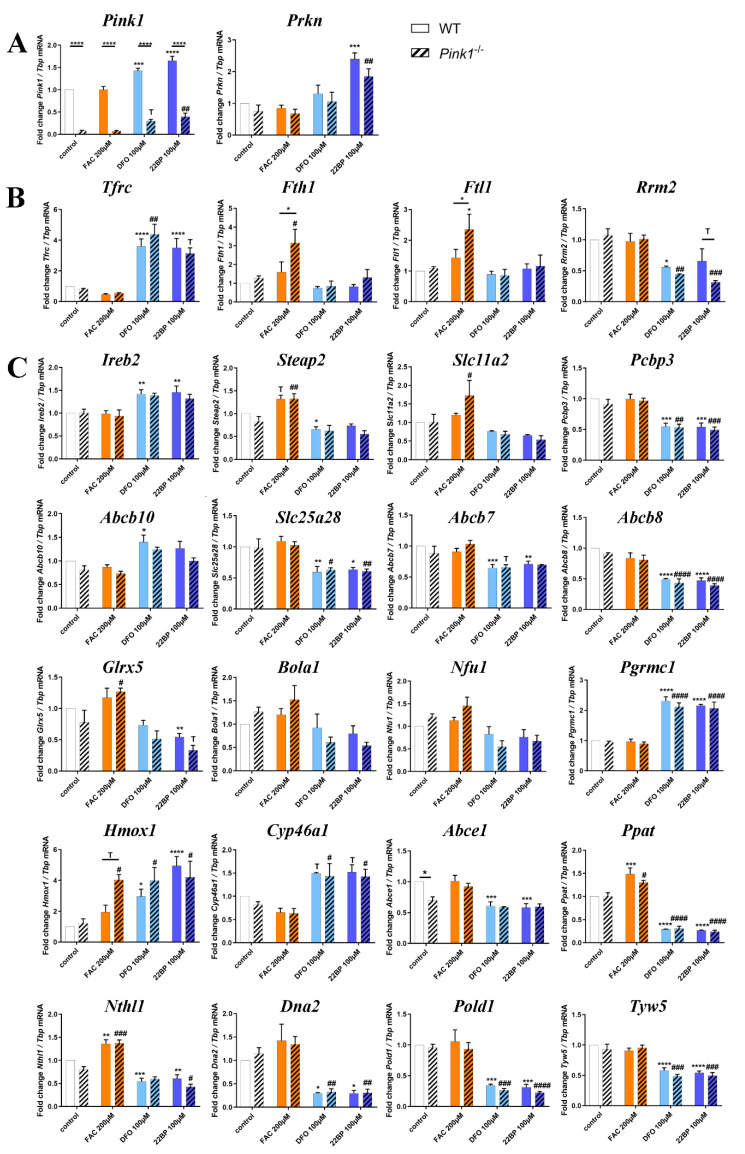
Figure 3.
Synopsis of mRNA expression dysregulations upon RT-qPCR in MEF cells (n = 3 WT for Pink1 and Prkn, else 6–12 WT versus 3 Pink1−/− for all other factors) after iron manipulation, focusing on (A) the mitophagy modulators Pink1 and Prkn, (B) key modulators of cellular iron uptake, storage, export, (C) iron transport and processing, mitochondrial iron homeostasis, heme production/turnover, ISC-biogenesis, and ISC-binding. All factors in (B,C) are presented in their approximate order of action during cellular iron homeostasis. Their expression adaptation was documented after iron overload (FAC) and under two different iron depletion conditions (DFO, 22BP), after normalization to Tbp expression levels as the loading control. Mean values with SEM (standard error of the mean) are shown, normalized to the WT control condition. The statistical trends or levels of significance are illustrated by symbols, namely T: 0.1 > p>0.05, * or #: p< 0.05, ** or ##: p < 0.01, *** or ###: p < 0.001, **** or ####: p < 0.0001. Mutant cells are represented by dashed bars, WT cells by plain colors. Asterisks are used for WT MEF to represent significant effects between treated and untreated control cells, while hashtags refer to Pink1−/− MEF with significant differences between treated versus untreated control cells. Genotype-dependent significant differences of Pink1−/− versus WT MEF are illustrated by horizontal lines below asterisks. Detailed fold-changes and p-values are listed in Supplementary Table S2.

