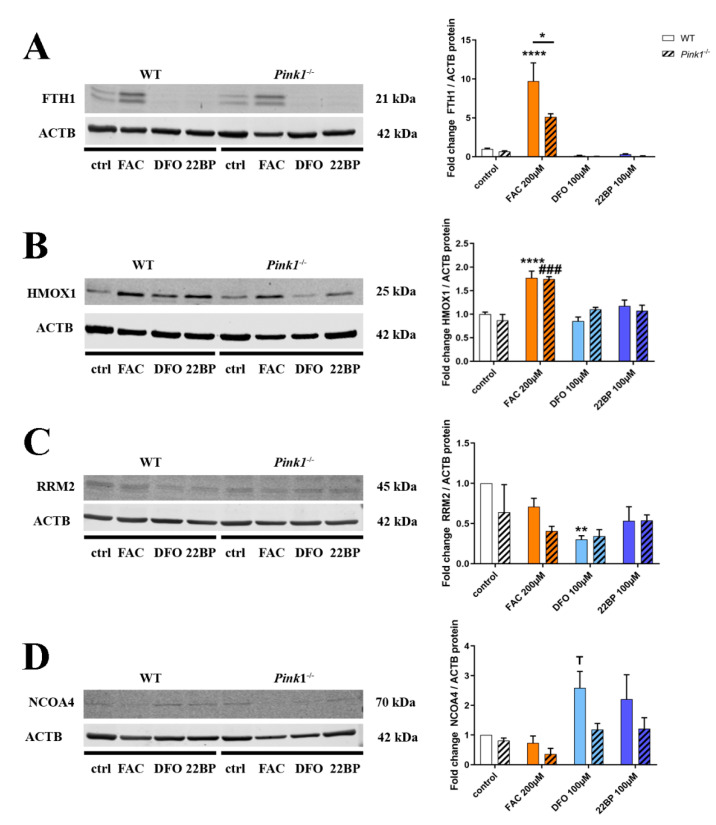
Figure 5.
Quantitative immunoblots for (A) FTH1, (B) HMOX1, (C) Ribonucleotide reductase regulatory subunit M2 (RRM2), and (D) nuclear receptor coactivator 4 (NCOA4) in WT and Pink1−/− MEF, under untreated control conditions (Ctrl), after iron overload (FAC) and after two different iron depletion drugs (DFO, 22BP), administered over 48 h. Protein abundance signals were normalized to beta-Actin levels (Actin beta (ACTB)) as a loading control. The panels on the right show their densitometric quantifications, normalized to WT untreated conditions. WT n = 4–6, Pink1−/− n = 3, one exemplary set is shown. The statistical trends or levels of significance are illustrated by symbols, namely T: 0.1 > p>0.05, *: p < 0.05, **: p < 0.01, ###: p < 0.001, ****: p < 0.0001. Mutant cells are represented by dashed bars, WT cells by plain colors. Asterisks represent significance in WT MEF, treated versus untreated control, while hashtags refer to Pink1−/− MEF, treated versus untreated control. Genotype-dependent significant differences of Pink1−/− versus WT MEF are illustrated by horizontal lines below asterisks.

