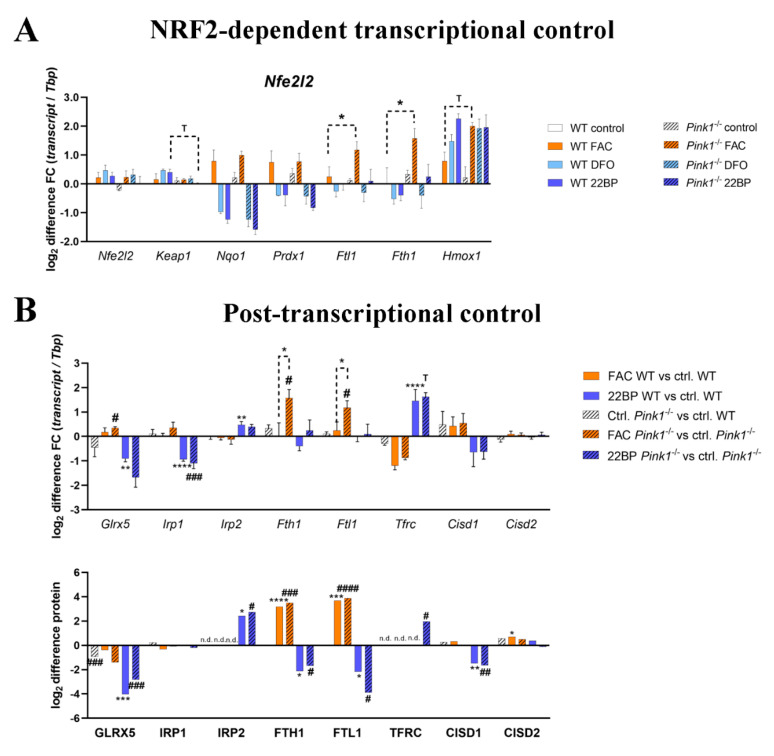
Figure 6.
Adaptation to changing iron concentrations for key factors in (A) the Nuclear factor, erythroid 2 like 2, Nfe2l2 (NRF2) transcription factor complex with its modulator Kelch-like ECH associated protein 1 (KEAP1) and their downstream transcript targets, as well as (B) the post-transcriptional control of iron import and storage. For mRNA expression analysis, the Tbp levels were used as loading control and after normalizing the fold changes to control conditions in WT MEF, the log2 fold changes of individual fold changes were calculated. The fold change of protein abundance label free quantification (LFQ) value was also represented as log2 difference. Mutant cells are represented by dashed bars, WT cells by plain colors. Asterisks represent significance in WT MEF, treated versus untreated control, while hashtags refer to Pink1−/− MEF, treated versus untreated control. To simplify the overview, in (A) only genotype-dependent significances are shown, whereas (B) includes all significances with respect to control conditions. Detailed p-values and individual fold changes can be seen in Supplementary Tables S1,2. The statistical trends or levels of significance are illustrated by symbols T: 0.1 > p>0.05, * or #: p < 0.05, ** or ##: p < 0.01, *** or ###: p < 0.001, **** or ####: p < 0.0001.

