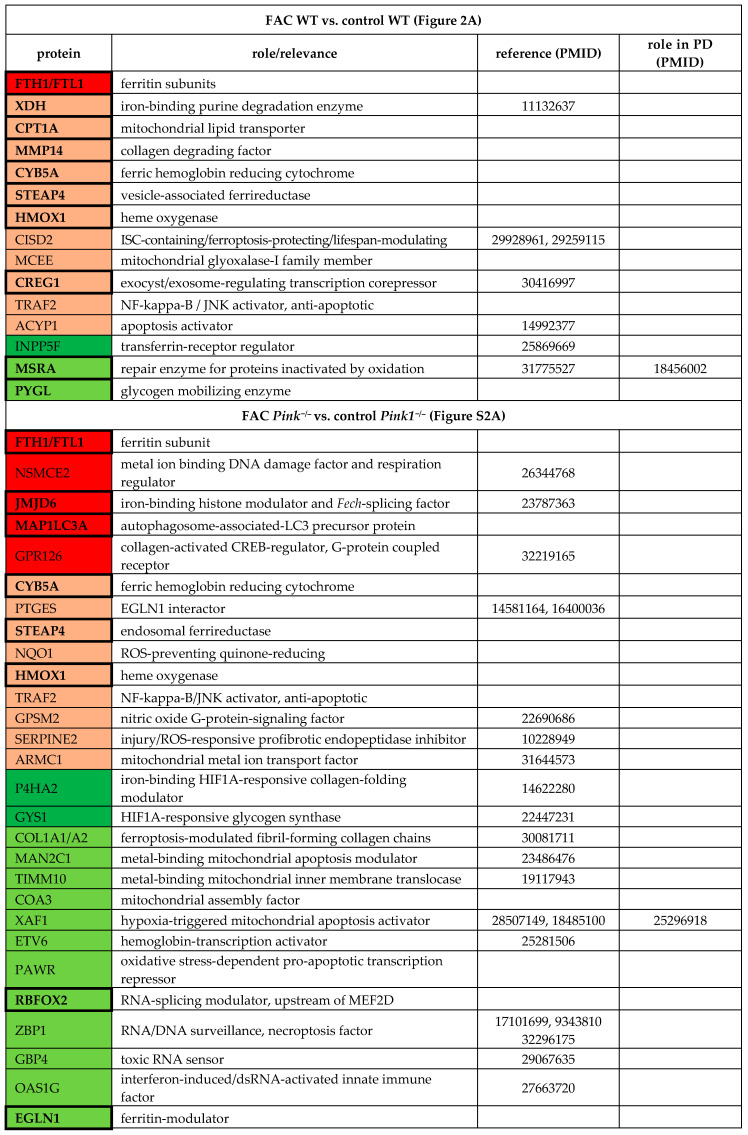
Table 1.
FAC effects. Overview of selected significantly changed factors in the global proteome of MEF, comparing FAC WT vs. control WT, and FAC Pink1−/− vs. control Pink1−/−, listing their respective roles and literature references (PubMedIDs), and highlighting special relevance for Parkinson’s disease (PD). Upregulations are shown with dark red (FDR > 0.05) and light red (p > 0.05), whereas downregulations are marked with dark green (FDR > 0.05) and light green (p > 0.05). Factors that show converse regulation after iron overload versus iron depletion and thus appear in several tables are marked with bold fonts. Factors with dysregulation in diverse conditions are emphasized by increased table cell border thickness. For details, see Figure 2 and Supplementary Table S1.

