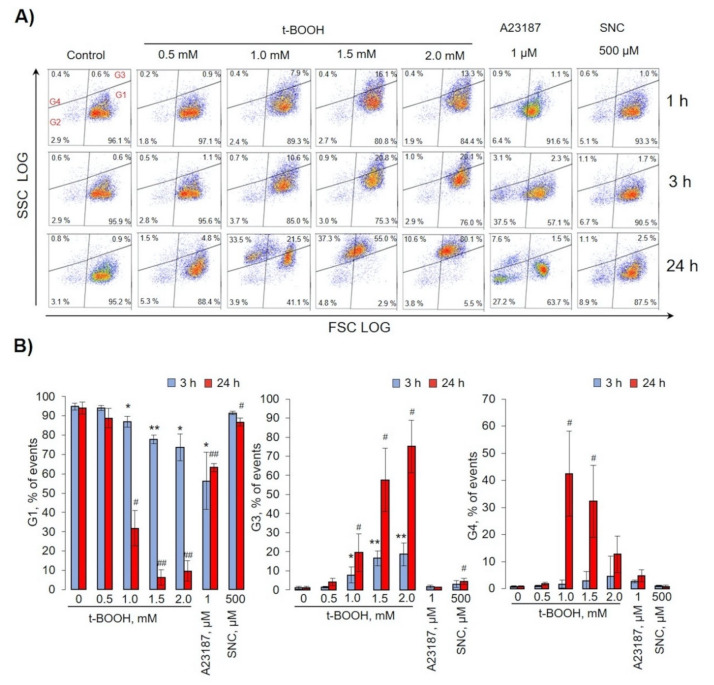
Figure 2.
Oxidative stress induced by t-BOOH-triggered RBC transformations and microvesicle formation. RBCs (0.5 × 10⁹ cells/mL) were incubated at indicated concentrations of t-BOOH, A23187, and S-nitroso-L-cysteine (SNC) at the indicated times. Gate 1 represents control RBCs, gate 2—microparticles (MPs), gate 3—transformed RBCs, and gate 4—microvesicles (MVs). (A) Representative dot plots out of six independent experiments. (B) Quantification of presented data expressed as mean ± SD, n = 6. One-way ANOVA, Tamhane T2 (G1, G2 24 h, G4), or Tukey HSD post hoc (G2 3 h) were used where appropriate. * p < 0.05, ** p < 0.001 compared to control (t-BOOH 0mM, 3 h); # p < 0.05, ## p < 0.001 compared to control (t-BOOH 0mM, 24 h).

