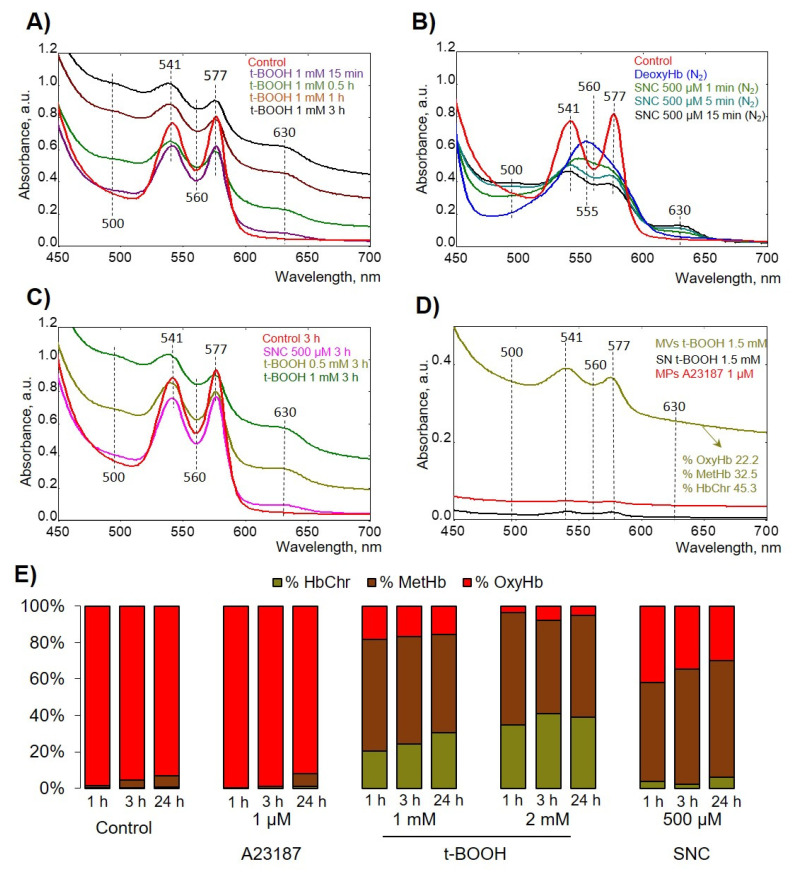
Figure 4.
t-BOOH induced hemichrome (HbChr) formation. Spectral scans from 450 to 700 nm captured the different oxidation states of hemoglobin (Hb) identified by characteristic peaks in the visible region. (A) Representative spectra of free Hb oxidation by 1mM t-BOOH (ferric, 500 and 630 nm; ferryl/HbChr, 545 nm, 576 nm, and a flattened region between 600 and 700 nm) in comparison with intact Hb spectra (ferrous, 541 and 576 nm) in HEPES-buffer at 25 °C in kinetics. (B) Representative spectra of free Hb oxidation by 500 µM SNC in deoxygenated by N2 HEPES buffer at 25 °C in kinetics. Free oxyHb was deoxygenated by N2 and then SNC was added for the indicated time. (C) Spectra of Hb from hypoosmotically lysed RBCs after 3 h treatment with indicated compounds at indicated concentrations. (D) After 24 h of RBC incubation with indicated compounds, we collected the MVs and MPs, as described in the Materials and Methods section, and then MVs/MPs and supernatant (SN) from the last washing step were analyzed. (E) Representative bar chart of Hb species calculated from one donor.

