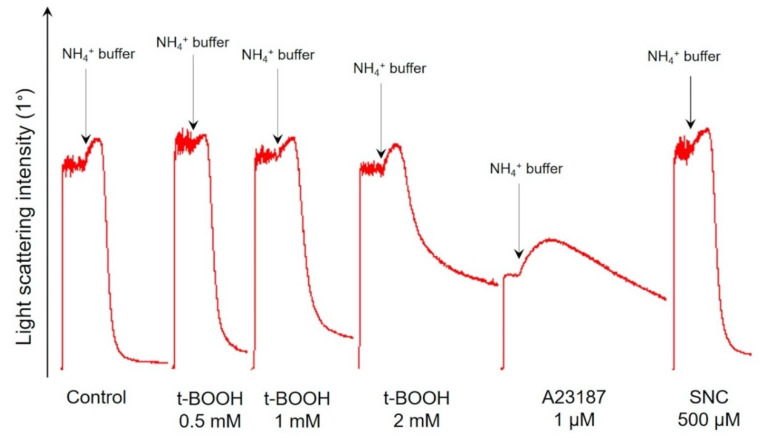
Figure 6.
OS dose-dependently decreased RBCs’ deformability and inhibited band 3 function. Representative hemolysis curves of ammonium stress test one of eight experiments. RBCs (0.5 × 10⁹ cells/mL) were incubated with the indicated compounds for 1 h, and then aliquots (10 µL, 106 cells/mL final concentration) of samples were resuspended in HEPES buffer to register light scattering intensity corresponding to control. Then aliquots (10 µL, 106 cells/mL final concentration) of samples were resuspended in NH4+ buffer for ammonium stress test. Arrows indicate the start of the ammonium stress test. Quantitation of these data is presented in Table 3.

