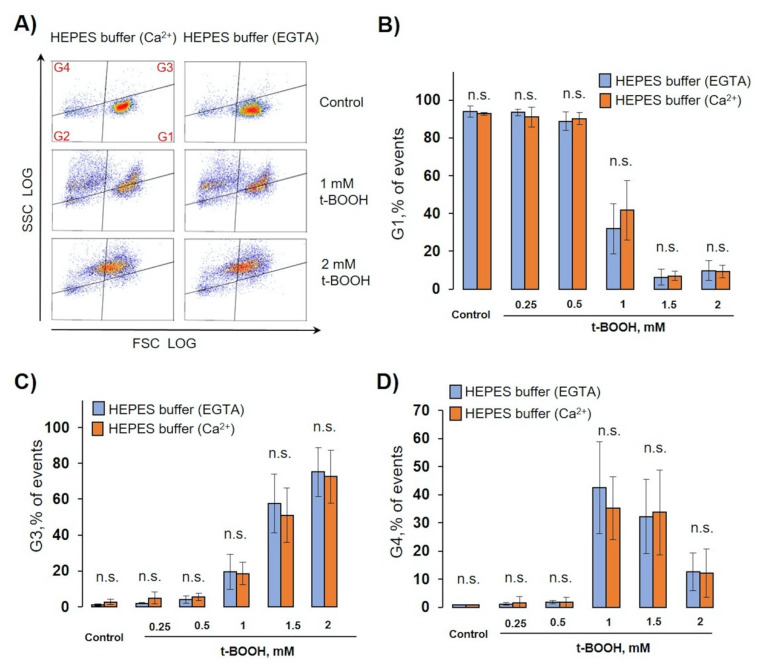
Figure 7.
OS-induced RBC transformation and MV formation were calcium-independent. RBCs (0.5 × 10⁹ cells/mL) were incubated with the indicated concentration of t-BOOH in HEPES buffer containing 2 mM calcium, or 2 mM EGTA, for indicated times and were analyzed by flow cytometry. (A) Representative SSC/FSC dot plots of one out of six independent experiments for 24 h. Template and gating correspond to Section 3.2. (B–D) Calculation of events distributed in the corresponding gates. Data are presented as mean ± SD (n = 7), paired t-test; n.s., not significant.

