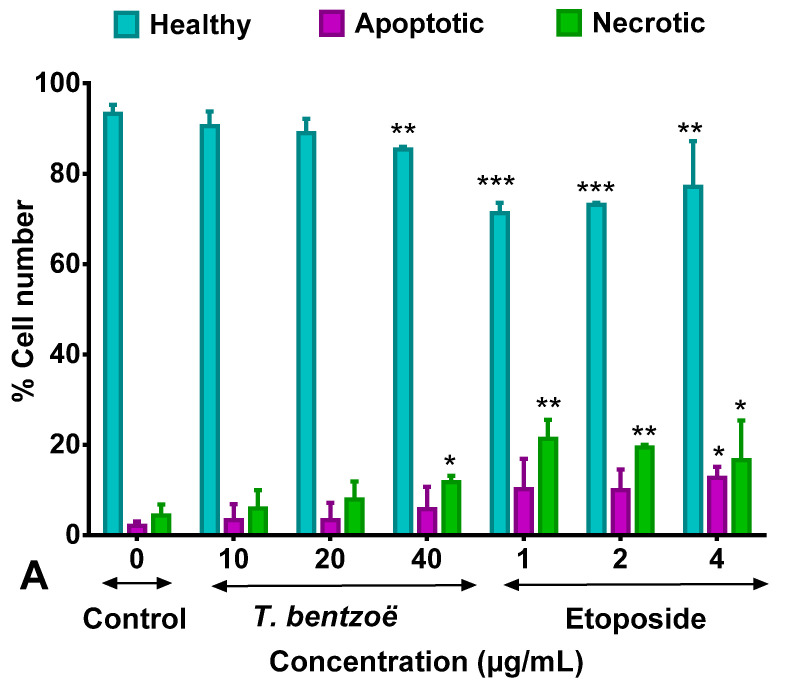
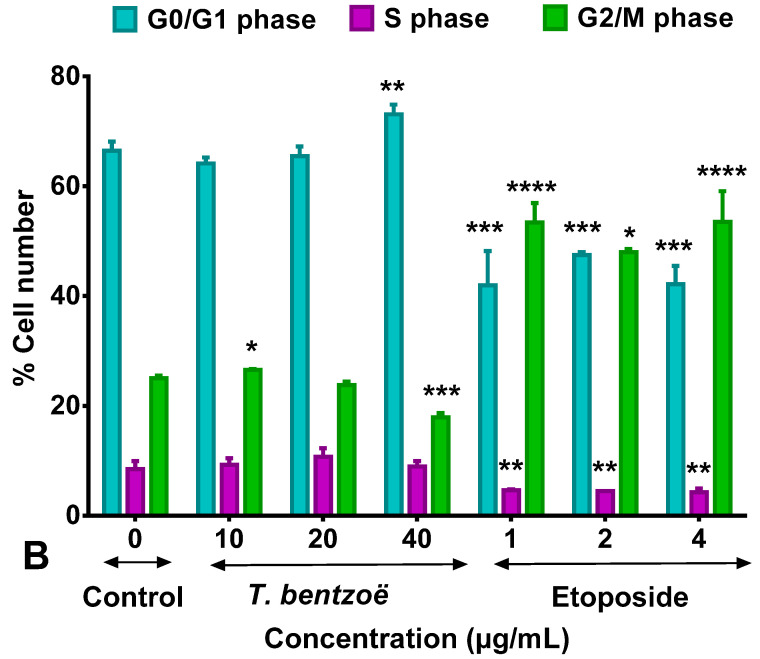
Figure 2.
Effect of Terminalia bentzoë and etoposide on HepG2 cells as analyzed by flow cytometry. (A) Annexin V-FITC/PI staining of HepG2 cells after 48 hours’ treatment and (B) cell cycle progression. Apoptosis and necrosis levels are expressed as percentage of the total cell population and given as mean ± SD (n = 5). Percentage of cells in different phases (G0/G1, S and G2/M phases) are expressed as mean ± SD (n = 3). Asterisks represent significant differences between test concentrations and dimethyl sulfoxide (DMSO) control. * p ≤ 0.05, ** p ≤ 0.01, *** p ≤ 0.001, **** p ≤ 0.0001.


