Figure 5.
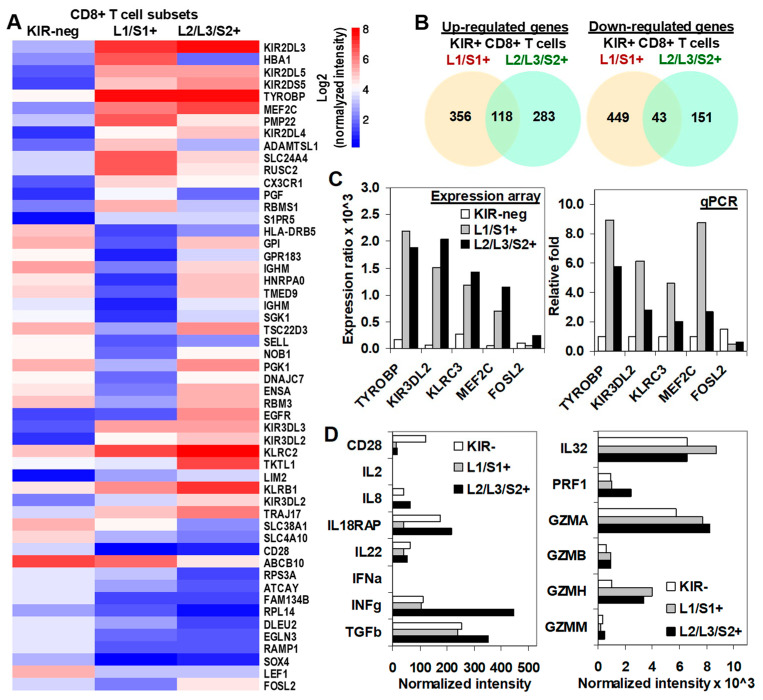
Transcriptional profiling of KIR2D− and KIR2D+ CD8+ T cells. (A) Differential gene expression profile (CodeLink Genome Array) of KIR− (column 1), KIR2DL1/S1+ (column 2), and KIR2DL2/L3/S2+ (column 3) CD8+ T cell subsets. The figure shows the top 40 most significantly modulated genes (designed with http://www.ehbio.com/ImageGP/). (B) Total number of up- and down-regulated genes in each KIR2D+ CD8+ T cell subset (analysis performed with jvenn software). (C) Microarray results were confirmed with real time quantitative RT-PCR (qPCR) analysis. Expression ratio (upper plot) and relative fold changes (lower plot) are shown for microarray and qPCR assays, respectively. Differential gene expression was considered significant with p < 0.05 in three independent cells preparations. Mean fold-changes in gene transcript expression levels between KIR2D− and KIR2D+ were evaluated with 2ΔΔCt. (D) Shows the normalized intensity of important molecules in the cytotoxic T cell biology and interleukin or interleukin receptors.

