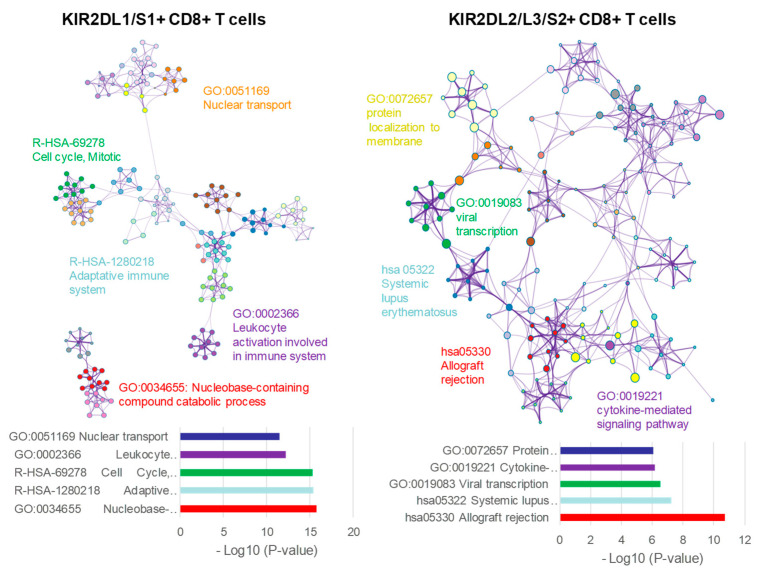
Figure 6.
Functional enrichment analysis with Metascape of KIR2DL1/S1+ and KIR2DL2/L3/S2+ CD8+ T cell populations.Network of enriched terms colored by cluster ID, where nodes that share the same cluster ID are typically close to each other. On the left (KIR2DL1/S1+ CD8+ T cells) and right (KIR2DL2/L3/S2+ CD8+ T cells) DEGs where analyzed and the five top clusters with their representative enriched terms are shown.

