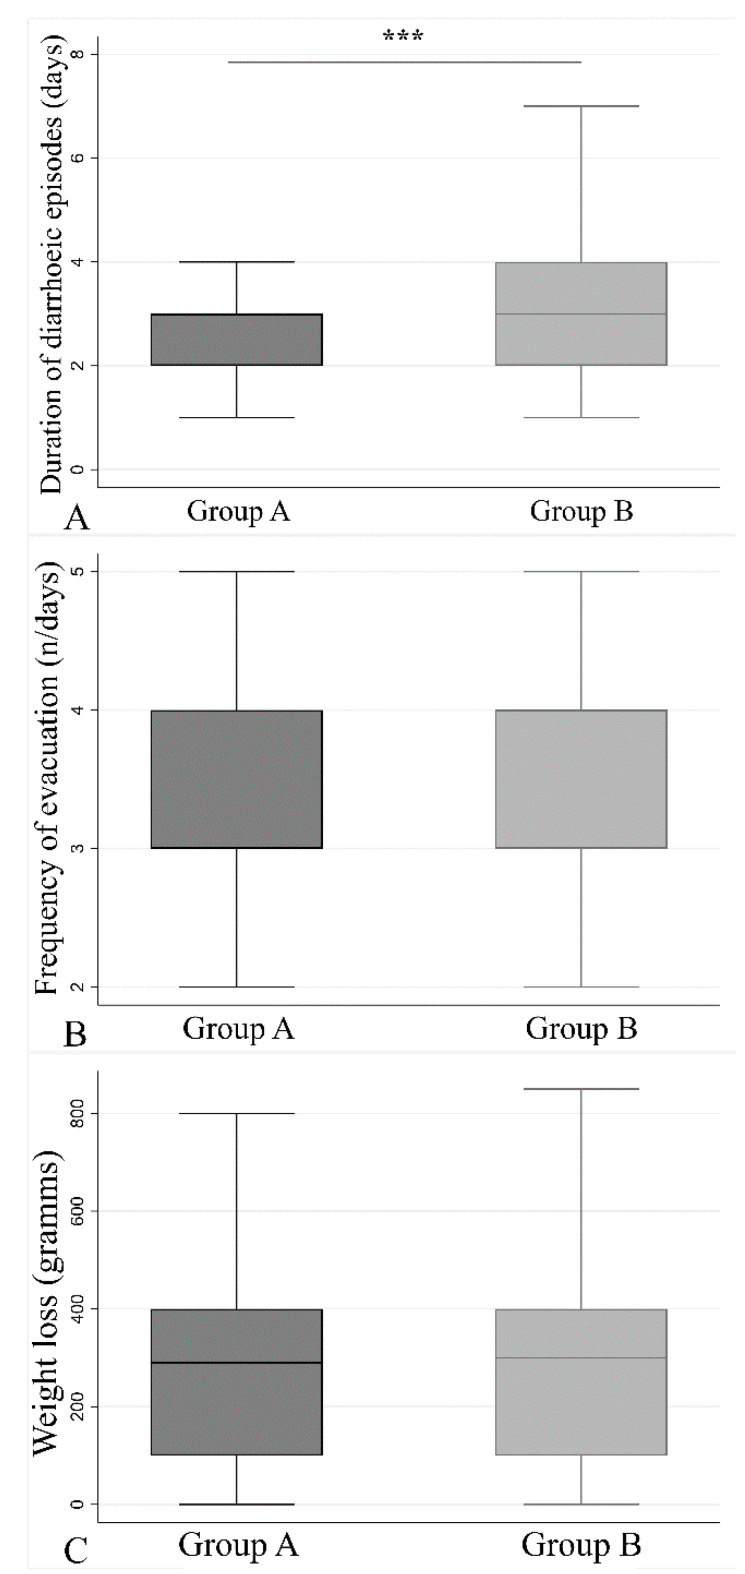
Figure 2.
Physiological parameters recorded for each group. Student’s t test was used to compare the two groups among the following parameters: number of days of antibiotic-associated diarrhea (AAD) is less in group A with respect to group B (A) (p < 0.001). The frequency of evacuation (B) and the weight loss (C) do not differ between the two groups, p = 0.856 and p = 0.512, respectively. (*** p value: <0.001).

