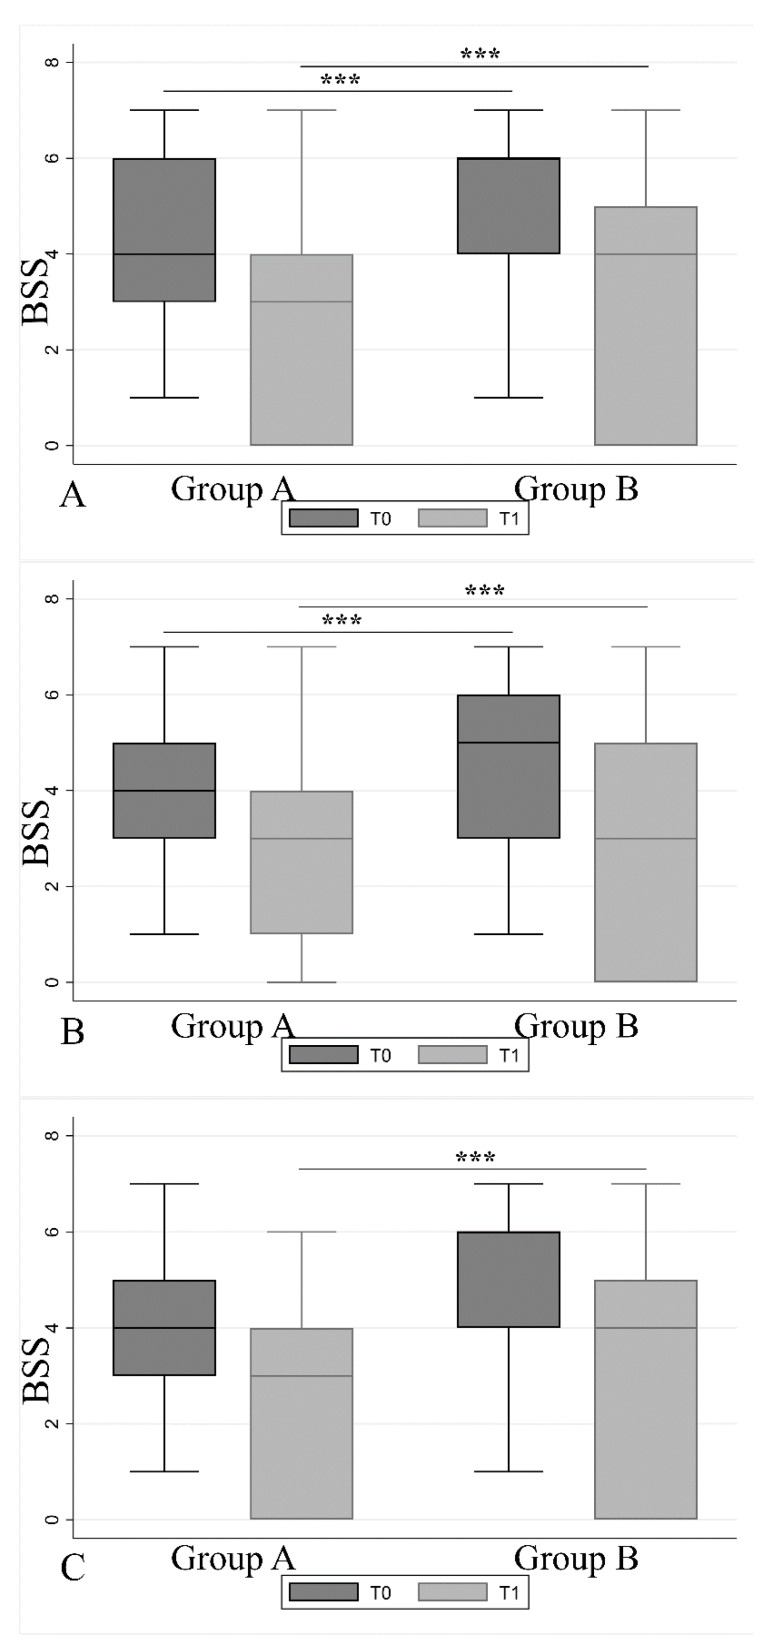
Figure 4.
Bristol Stool Scale comparison among the three antibiotic categories over T0 and T1. One-way ANOVA (between group A and B) followed by multiple comparison (Tukey’s multiple comparisons test) found strong statistical difference among (A) penicillins, (B) cephalosporins, and (C) macrolides at the end of the antibiotic treatment (T0) and 30 days after (T1). (p < 0.0001.) (*** p value: <0.001.) For more detail, refer to Supplemental Table S3.

