Figure 1.
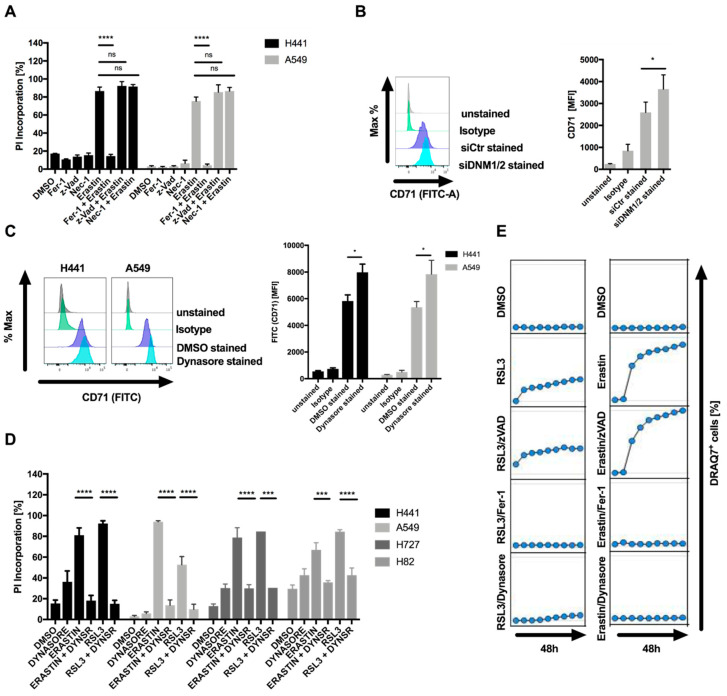
Dynasore inhibits ferroptosis. (A) The indicated cell lines were treated with DMSO, ferrostatin-1 (5 µM), erastin (10 µM), zVAD (20 µM), Nec-1 (20 µM) or the indicated combinations for 48 h. Cell death was quantified by propidium iodide (PI) uptake and flow cytometry. (B) H441 cells were transfected with control or dynamin 1 and 2 (DNM1-2)-targeting small interfering RNA (siRNA) for 48 h. Surface expression of CD71 was determined by staining and flow cytometry. (C) The indicated cells were treated with dynasore for 48 h. Surface expression of CD71 was quantified as in B. (D) Cells as indicated were treated and quantified as in A, but replacing ferrostatin-1 by dynasore (80 µM). (E) A549 cells were treated with DMSO, ferrostatin-1 (5 µM), erastin (10 µM), zVAD (20 µM), dynasore (80 µM) or the indicated combinations. Images were acquired every 8 h for 48 h. Dead cells were quantified as % DRAQ7 + cells using the IncuCyte image analysis software. All data are means +/− standard error of the mean (SEM) of at least three independent experiments, or representative images where applicable. MFI—mean fluorescence intensity. * indicates p < 0.05; ** indicates p < 0.01; *** indicates p < 0.001; **** indicates p < 0.0001; ns indicates non-significant differences.

