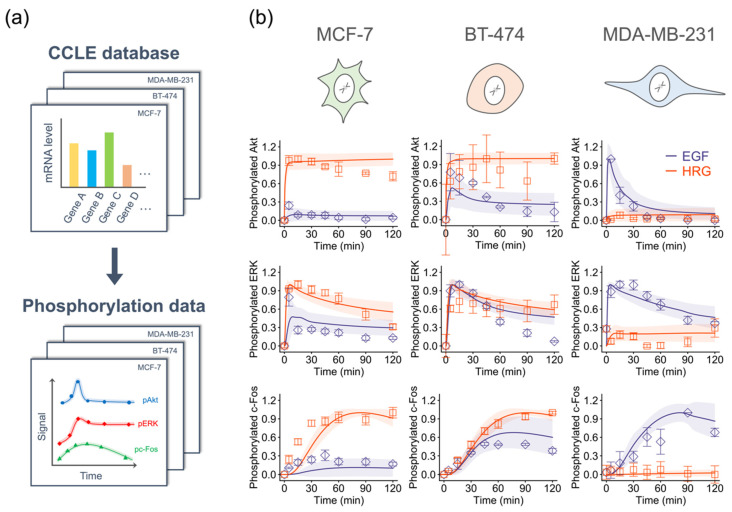
Figure 3.
Parameter training against experimental datasets. (a) Overview of the parameterization procedure. (b) Results of parameter estimation. Points: (Blue diamonds, EGF; red squares, HRG) denote experimental data and lines denote the averaged simulation results of 30 parameters, and shaded areas indicate standard deviation. For all panels, error bars denote standard error for three independent experiments. The Western blot images can be found in Figure S1.

