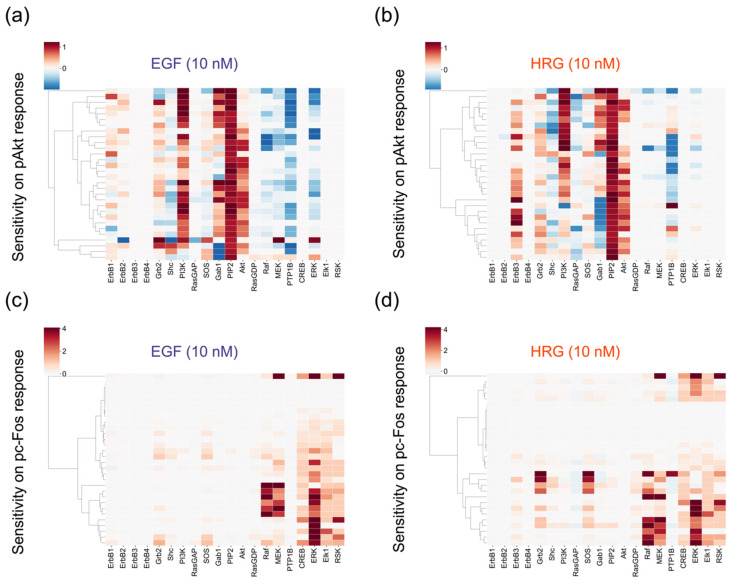
Figure 5.
Results of sensitivity analysis. Negative coefficients (blue) indicate that the quantity of the response metric will decrease when the amount of a species increases, while positive coefficients (red) indicate that the metric will increase. (a) Epidermal growth factor (EGF)-induced pAkt response. (b) heregulin (HRG)-induced pAkt response. (c) EGF-induced pc-Fos response. (d) HRG-induced pc-Fos response.

