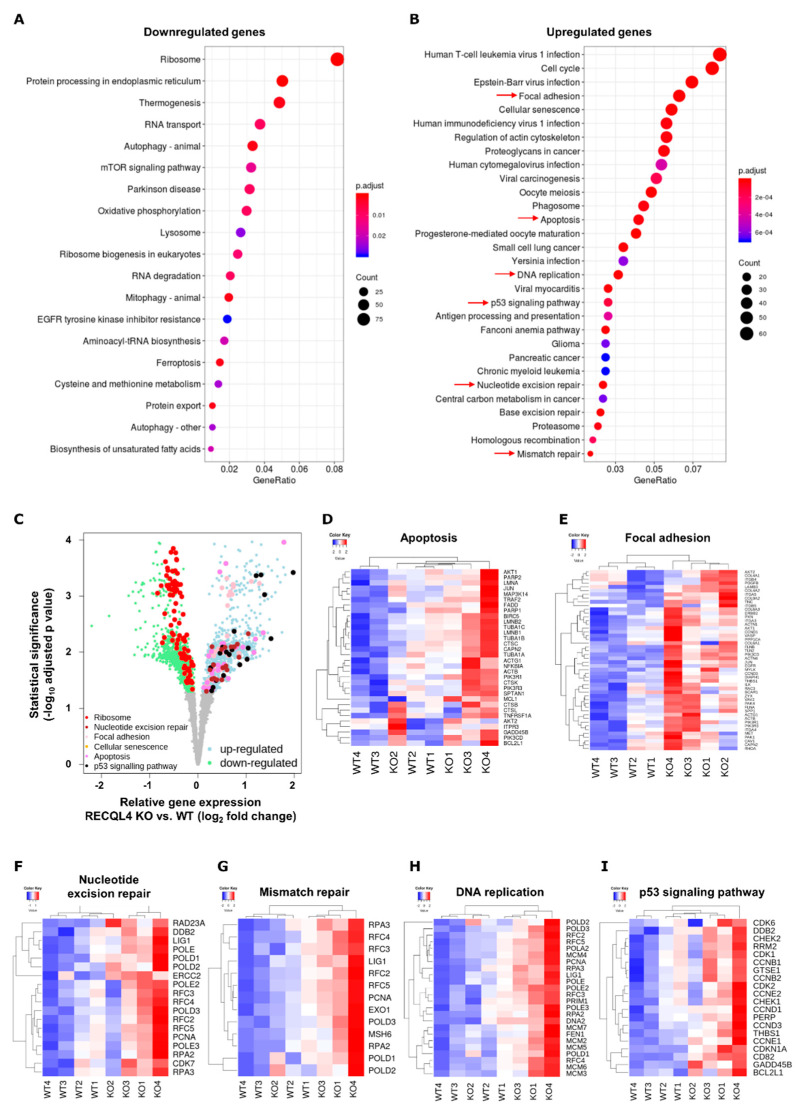
Figure 3.
RNA-seq reveals gross transcriptomic changes in RECQL4-depleted glioma cells. Total RNA from WT and RECQL4 KO#2 glioma cells were subjected to RNA sequencing. KEGG analysis of DE genes (FDR corrected p < 0.05) shows genes/pathways downregulated (A) or upregulated (B) in RECQ4 KO cells when compared to WT cells. (C) Volcano plot shows down- and upregulated genes (log2 fold change < 0 and log2 fold change > 0, respectively, and FDR-correction p < 0.05) in RECQ4 KO cell lines relative to the WT. Genes from selected functional KEGG categories (q-value < 0.05) as marked by red arrows on panel (B) are marked in different colours, as indicated in the legend in bottom left of the panel (C). Selected KEGG pathways are also presented on z-score heatmaps: apoptosis (D) focal adhesion (E) nucleotide excision repair (F) mismatch repair (G) DNA replication (H) and p53 signalling pathway (I).

