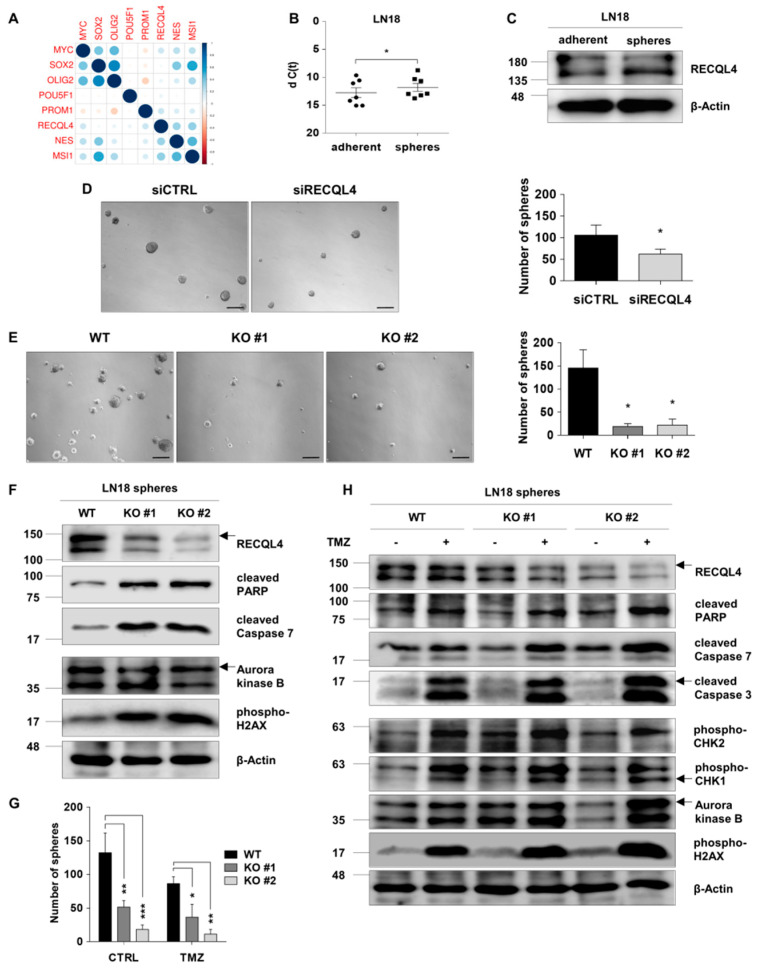
Figure 4.
RECQL4 supports self-renewal of glioma stem cells and their resistance to temozolomide. (A) Pearson’s correlation between expression of RECQL4 and selected stem cell markers in the TCGA dataset showed significant positive correlation of RECQL4 and MYC, NES, PROM1 and MSI1 genes. (B) qPCR analysis of the RECQL4 mRNA level in LN18 spheres and parental adherent cells. The expression was normalized to GAPDH; the results represent mean ± SEM (n = 7 different sphere cultures). Statistical significance was determined by two-tailed paired t-test. p-Values were considered as significant when * p < 0.05. (C) Representative immunoblot showing RECQL4 expression in LN18 spheres and adherent cells. β-Actin was used as a loading control. (D) Representative images and quantification of LN18 spheres (at day 7th) after siRNA-mediated RECQL4 knockdown compared to control siRNA transfected spheres. Scale bar represents 200 µm. The results are shown as numbers of spheres (≥100 µm in diameter were counted) and represent means ± SEM (n = 4). Statistical significance was determined by two-tailed paired t-test. p-Values were considered as significant when * p < 0.05. (E) Representative images and quantification of (at day 7th) WT and RECQL4 knockout LN18 spheres. (F) Representative immunoblots showing analysis of cell death, proliferation and cell cycle proteins in WT and RECQL4 KO LN18 spheres. (G) Quantification of spheres in WT and RECQL4 KO cultures exposed to 500 µM TMZ for 72 h. The results are shown as numbers of spheres and represent the means ± SEM (n = 3). Statistical significance was determined by RM two-way ANOVA, with followed by Tukey’s HSD post hoc test. P values were considered as significant when * p < 0.05, ** p < 0.01, *** p < 0.001. (H) Representative immunoblots show the levels of cell death, proliferation and cell cycle proteins in WT and RECQL4 KO LN18 spheres 72 h after TMZ treatment.

