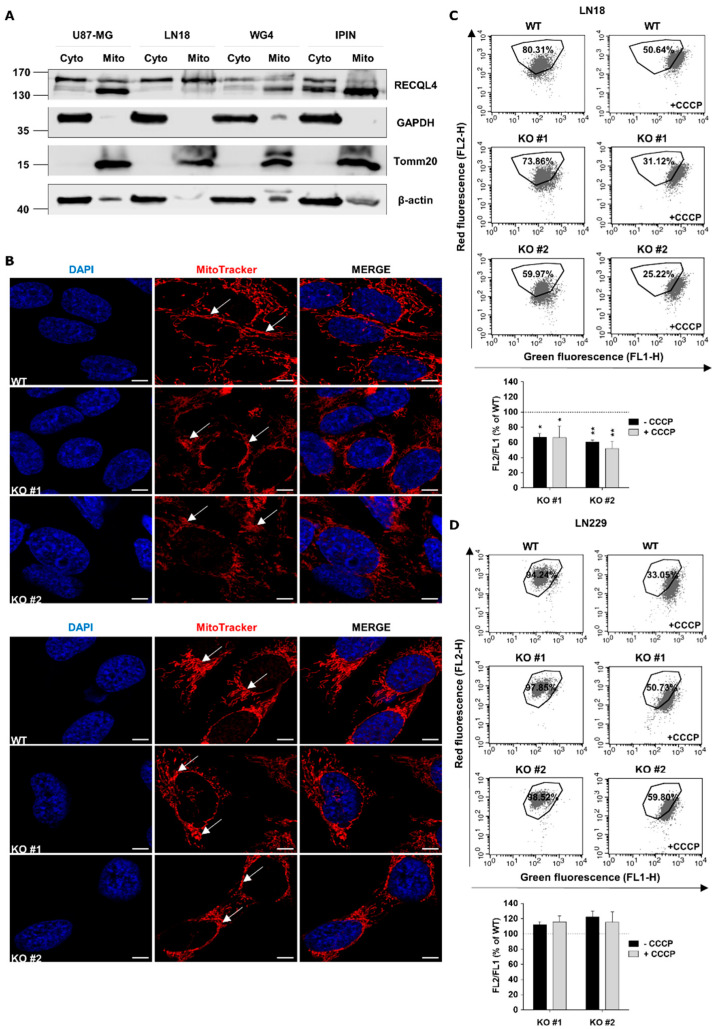
Figure 5.
RECQL4 depletion affects morphology and functions of mitochondrial network in glioblastoma cells. (A) Representative immunoblots showing subcellular distribution of RECQL4 in cytosolic (Cyto) and mitochondrial (Mito) fractions of human U87-MG, LN18 and primary WG4, IPIN cultures of glioblastoma cells. Expression of GAPDH and Tomm20 was used as a loading control and markers for cytosolic and mitochondrial fractions, respectively. (B) Representative images of mitochondrial morphology and network organisation in LN18 (upper panel) and LN229 (bottom panel) cells analysed by confocal microscopy. WT and RECQL4 KO cells were stained for mitochondria (MitoTracker, red) and nuclei (DAPI, blue). Scale bar represents 5 µm. (C) Representative histograms and quantification of mitochondrial transmembrane potential changes in WT and KO LN18 cells. The cells were stained with JC-1 probe and analysed by FACS. CCCP was used as a positive control. The results are shown as red/ green fluorescence intensity ratio (relative FL-2/ FL-1) in RECQL4 KO cells normalized to WT cells, and represent means ± SEM (n = 3). Statistical significance was determined by RM two-way ANOVA, with followed by Tukey’s HSD post hoc test. P values were considered as significant when * p < 0.05, ** p < 0.01. (D) Representative histograms and quantification of mitochondrial transmembrane potential changes in WT and RECQL KO LN229 cells.

