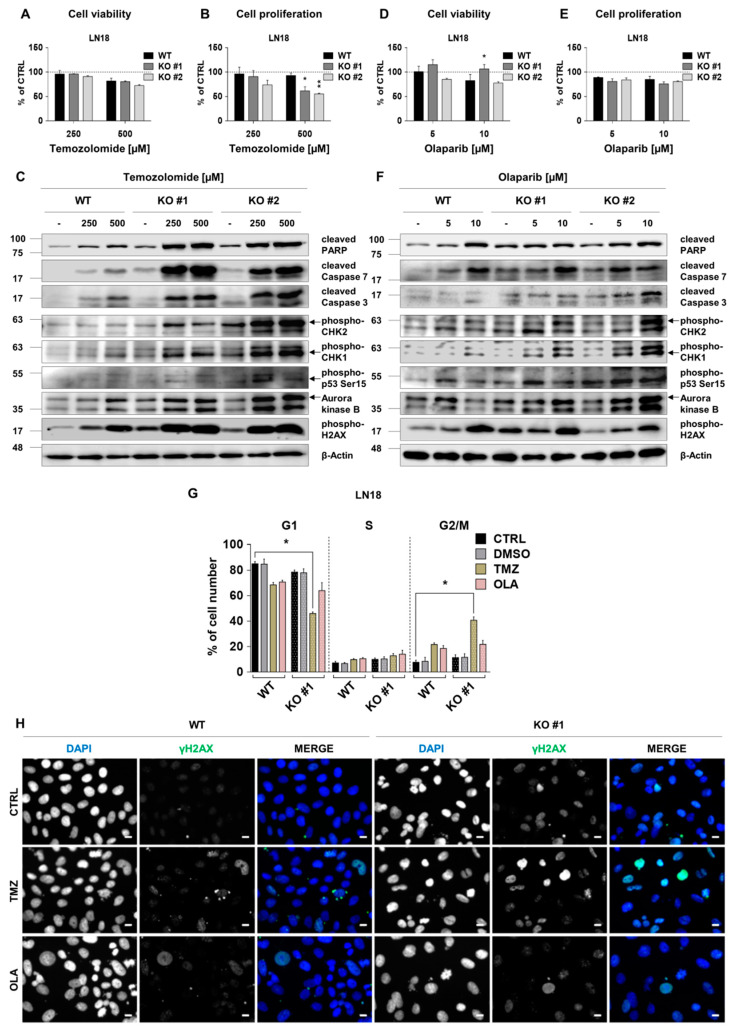
Figure 6.
RECQL4 deficiency sensitises LN18 glioblastoma cells to temozolomide or olaparib. WT and RECQL4 KO LN18 cells were exposed to TMZ at concentrations of 250 and 500 µM for 72 h, and cell viability (A) and proliferation (B) were analysed. The results were normalized to untreated cells (CTRL) and represent means ± SEM (n = 4). Statistical significance was determined by RM two-way ANOVA, followed by Tukey’s HSD post hoc test. p-Values were considered as significant when * p < 0.05, ** p < 0.01. (C) Representative immunoblots showing the levels of cell death, proliferation and cell cycle proteins after TMZ treatment. β-Actin was used as a loading control. WT and RECQL4 KO LN18 were exposed to olaparib for 72 h and analysed for cell viability (D) and proliferation (E). The results were normalized to control cells (CTRL, with 0.05% DMSO as a solvent) and represent means ± SEM (n = 4). Statistical significance was calculated as above. (F) Representative immunoblots showing the levels of cell death, proliferation and cell cycle proteins after olaparib treatment in WT and RECQL4 KO cells. β-Actin was used as a loading control. (G) Cell cycle distribution analysis of WT and RECQL4 KO LN18 cells after TMZ (500 µM) or OLA (10 µM) treatment for 72 h. The results are shown as percentage of cell number in each phase of the cell cycle and represent means ± SEM (n = 3). Statistical significance was determined by Kruskal–Wallis one-way ANOVA followed by Dunnett’s post hoc test. p-Values were considered as significant when * p < 0.05., ** p < 0.01. (H) Representative images of immunofluorescent staining showing γH2AX foci and cell nuclei in WT and RECQL4 KO LN18 cells exposed to TMZ (500 µM) or OLA (10 µM) for 48 h. Scale bar represents 10 µm.

