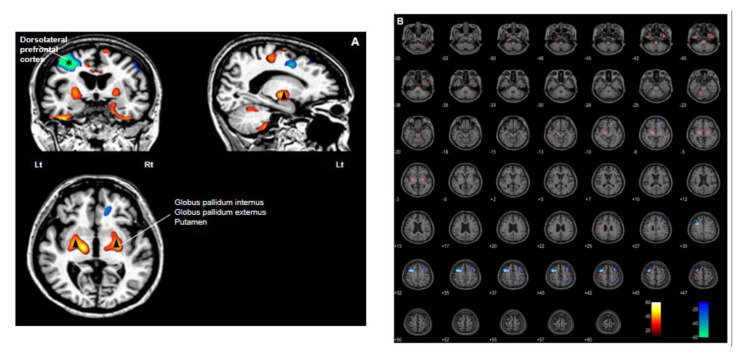
Figure 6.
PET/MRI co-registration and voxel-based subtraction analysis of one year after deep brain stimulation (DBS) from pre-operation. Red scale indicates an increase in glucose metabolism and blue scale indicates a decrease in glucose metabolism. (A) A noticeable decrease in glucose metabolism in the dorsolateral prefrontal cortex (DLPFC) (asterisk) and an increase in glucose metabolism in the ventrolateral thalamus, globus pallidum internus (Gpi), globus pallidum externus (Gpe) and putamen (arrowhead). (B) A noticeable decrease in glucose metabolism was observed in the DLPFC, especially in the left hemisphere and an increase in glucose metabolism was identified in the medulla, pons, midbrain, cerebellar lobules, inferior temporal lobe, ventrolateral thalamus, Gpi, Gpe, putamen, and premotor cortex bilaterally on PET/MRI images obtained one year after DBS and compared with preoperative PET/MRI.

