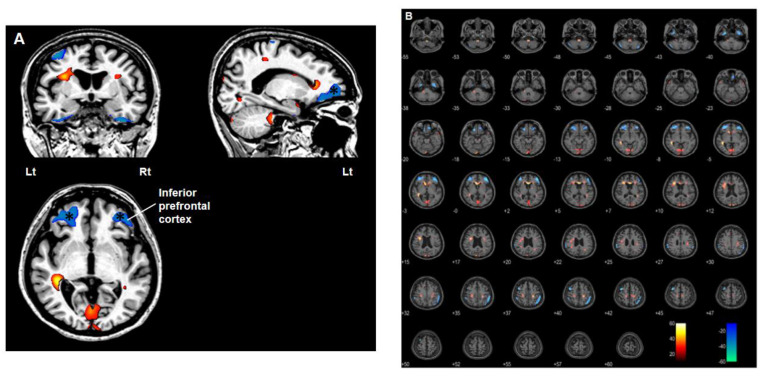
Figure 7.
PET/MRI co-registration and voxel-based subtraction analysis of three years after deep brain stimulation (DBS) from pre-operation. Red scale indicates an increase in glucose metabolism and blue scale indicates a decrease in glucose metabolism. (A) A noticeable decrease in glucose metabolism in the orbitoprefrontal and inferior prefrontal cortex (asterisk). (B) A bilateral decrease in glucose metabolism was observed in the cerebellum, inferior temporal lobe, sensory cortex, superior parietal cortex and, especially orbito-, and inferior prefrontal cortex and an increase in glucose metabolism was identified in the medulla, pons, midbrain, occipital cortex including cuneus and calcarine sulcus, motor cortex mainly for leg and feet, anterior part of the insula, anterior cingulate cortex and genu of corpus callosum on the PET/MRI images obtained three years after DBS.

