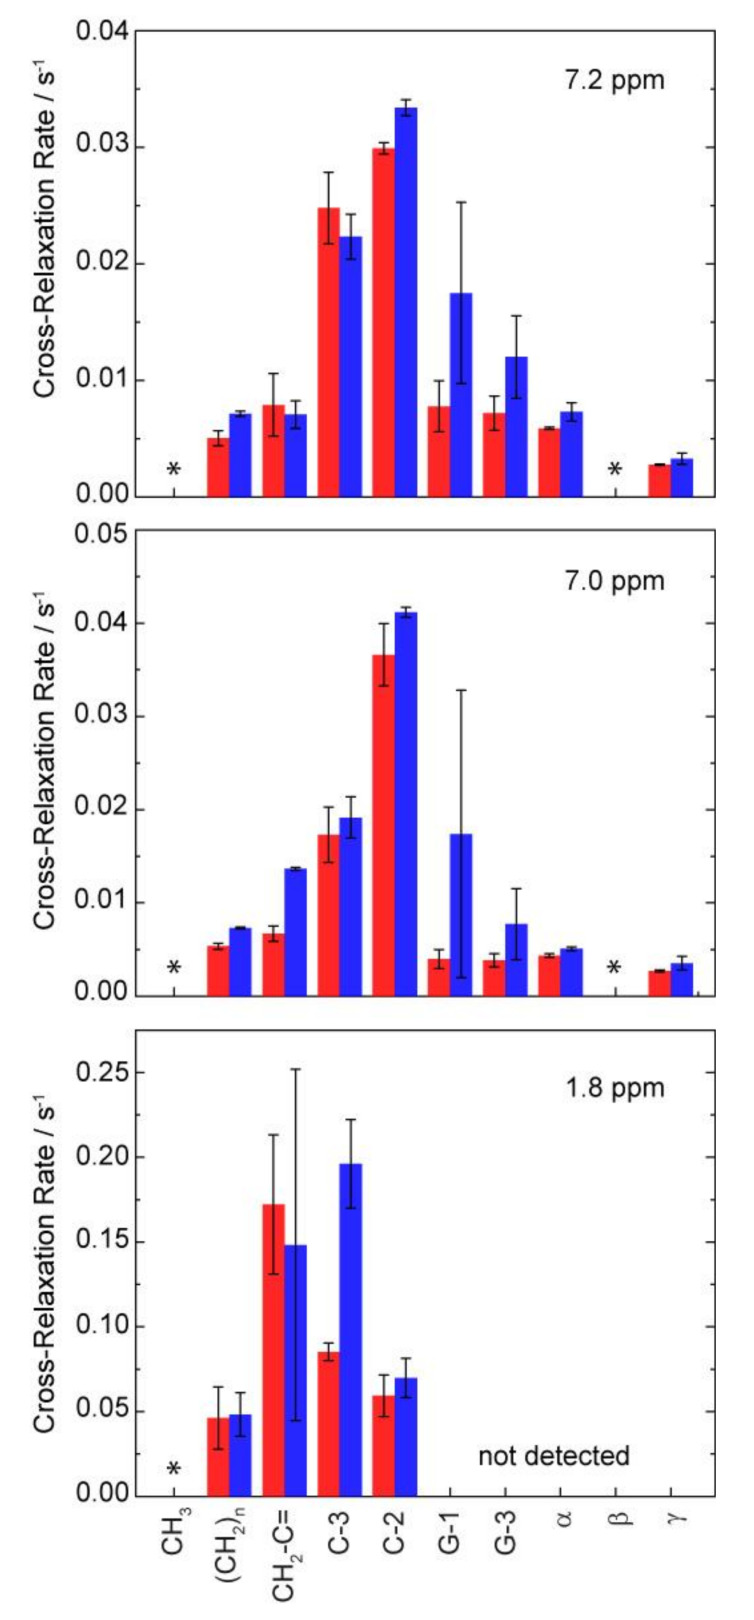
Figure 6.
NOESY cross-relaxation rates between the three resolved signals of ibuprofen and the respective molecular segments of POPC along the membrane normal in POPC (red) and in POPC/cholesterol (80/20, mol/mol) (blue) membranes in the presence of 10 mol% ibuprofen. Cross-relaxation rates for the positions marked by * were not analyzed because of a significant signal overlap of ibuprofen and POPC signals. For the ibuprofen signal at 1.8 ppm, only cross peaks for the chain region of POPC were clearly observed.

