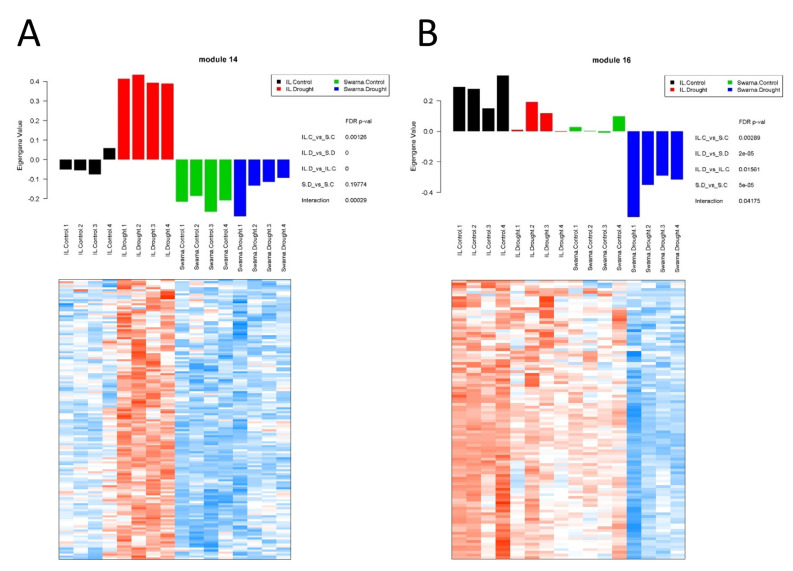
Figure 4.
Gene co-expression network analysis in flag-leaf under RDS. Bar plots of the module eigengene as representatives of gene expression profiles across samples in FL-M14 (module 14) (A) and FL-M16 (module 16) (B). X-axis represents 16 different samples across four different groups, while Y-axis corresponds to the eigengene value. Heatmaps showing gene expression levels of genes in FL-M14 and FL-M16. Columns represent samples, while rows correspond to genes in the module. Red indicates positive and blue negative expression profile. S.C = Swarna control, S.D = Swarna under RDS, IL.C = DTY-IL control, IL.D = DTY-IL under RDS.

