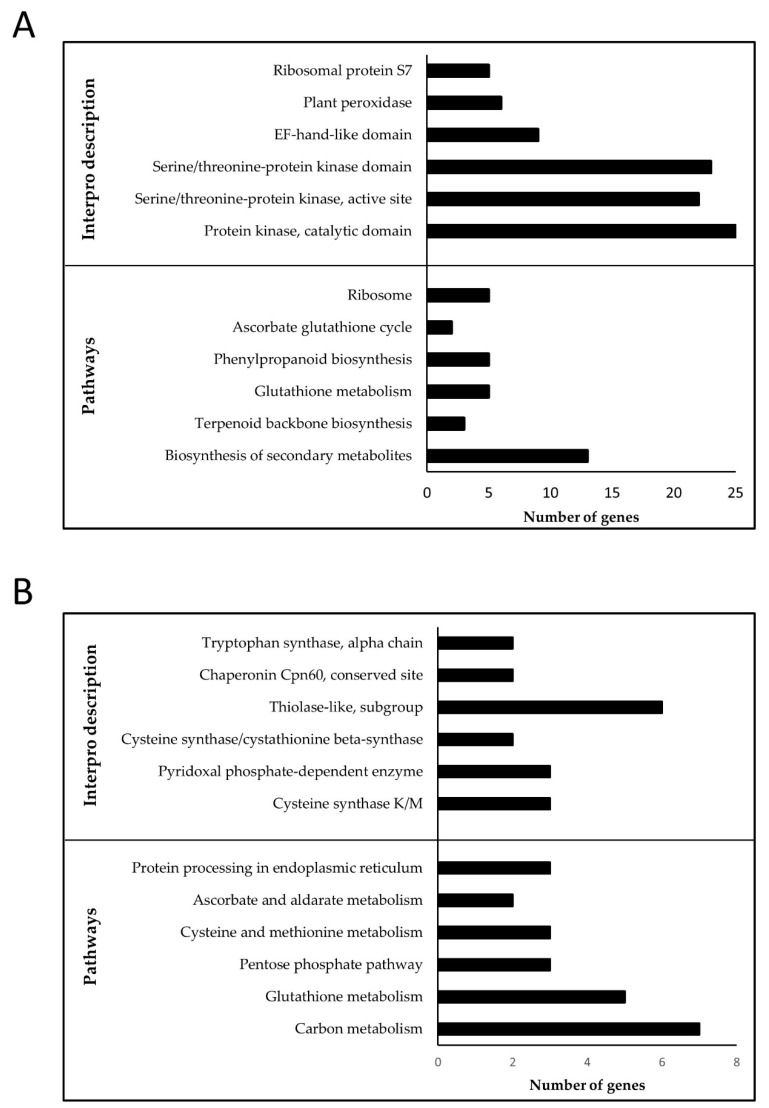
Figure 8.
Enrichment analysis of the functional categories in P-M10 and P-M15. Over-represented Interpro domains and enriched pathways in P-M10 (A) and P-M15 (B) in panicle under RDS. Top significant pathways and Interpro domains are shown in Y-axis with the number of represented genes on the X-axis.

