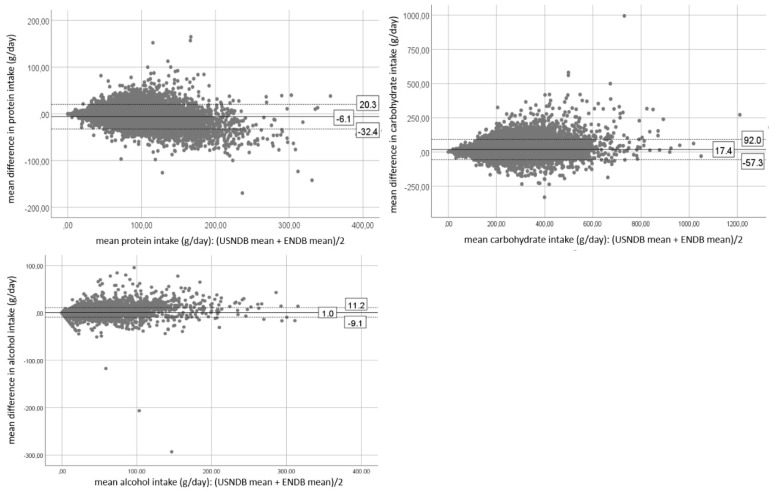
Figure 1.
Bland-Altman plots for the 24-h dietary recall (24-HDR) data representing the mean differences and their limits of agreement for energy, total fat, proteins, carbohydrates and alcohol intakes between the U.S. nutrient database (USNDB) and the EPIC nutrient database (ENDB). The mean difference is represented by the full line, the upper and lower limit of agreement are presented by dotted lines.


