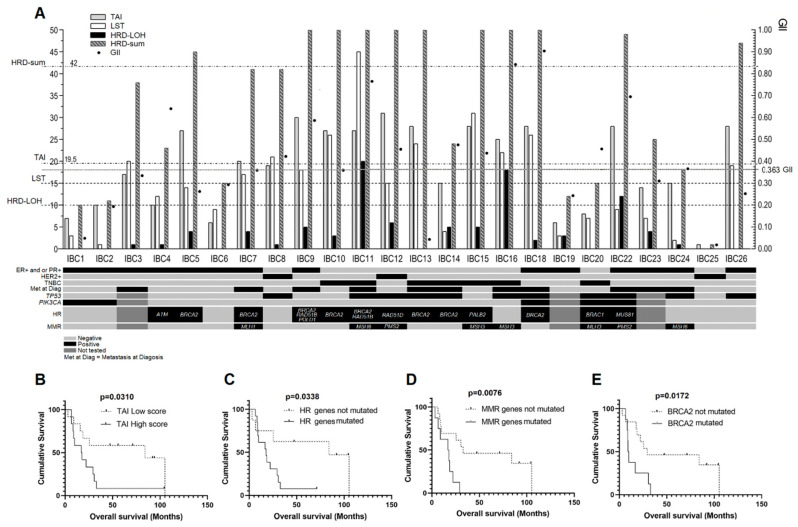
Figure 2.
Graphical representation of homologous recombination deficiency (HRD)-associated scores (TAI, LST, HRD-LOH, and HRD-sum) and GII. (A) The dashed lines represent the thresholds for high and low scores. Cases with variants in homologous recombination (HR) genes, TP53, PIK3CA and mismatch repair (MMR) genes are also indicated. For the HR and MMR genes, the specific altered genes are shown, while variants in TP53 and PIK3CA are represented by the plus sign (+). For technical issues, IBC3, IBC9, and IBC23 were not submitted to sequencing analysis. (B) Significant differences in overall survival curves according to TAI status. (C) HR variants. (D) MMR variants. (E) BRCA2 variants.

