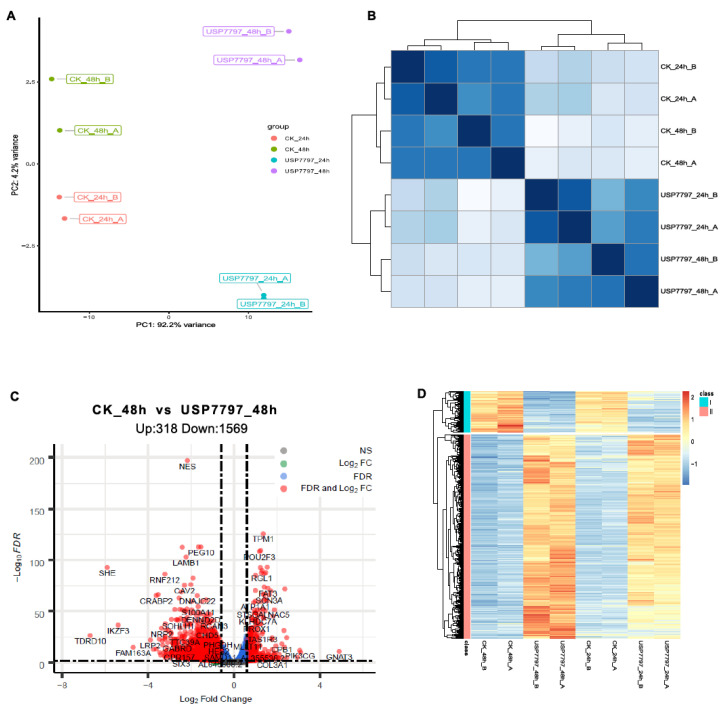
Figure 3.
Exploratory and differential expression analyses of RNA-seq data. (A) Principal-component analysis of sample relationship. (B) Poisson distance plot of sample dissimilarities in terms of transcriptomic profiles. (C) Volcano plot of shrunken log2 (fold change) and –log10FDR of all tested genes between vehicle-control (CK) samples and samples treated with USP7797 at 48 h post treatment. Genes with|log2(fold change)| > log2(1.5) and FDR < 0.05 (significantly differentially expressed genes) are in red, genes with|log2(fold change)| > log2(1.5) but FDR ≥ 0.05 are in green, genes with|log2(fold change)| ≤ log2(1.5) but FDR < 0.05 are in blue, and the rest are in gray. (D) Heatmap showing significantly differentially expressed genes which are represented by red dots in (C).

