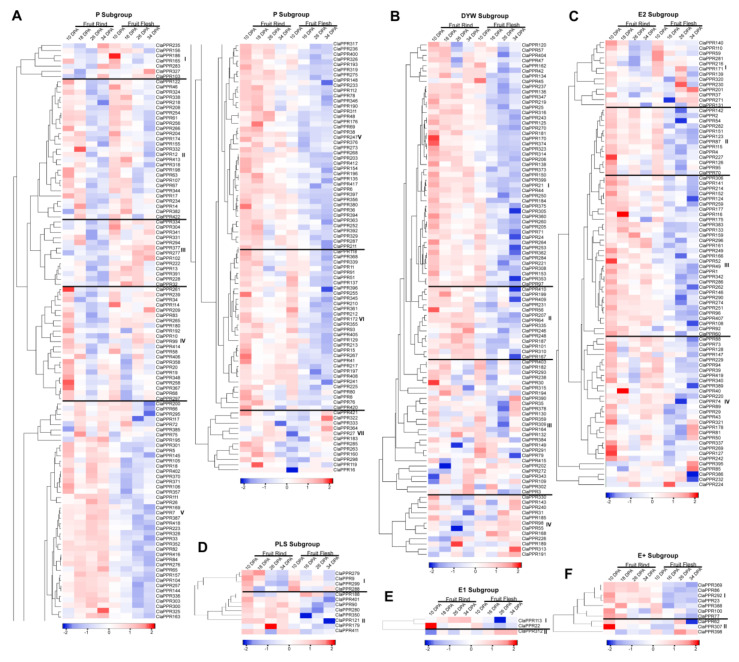
Figure 5.
Expression profiles of ClaPPR genes during watermelon fruit development (Cultivar 97103; BioProject: SRP012849). All heat maps showing various expression levels of ClaPPR genes and subdivided into various clusters (labeled as roman numerals) were built using log2- transformed FPKM values of fruit rind and flesh at the developmental stages of 10, 18, 26, and 34 days after pollination (DAP). (A) Expression profiles of ClaPPR genes in the P subfamily, (B–F) Expression profiles of ClaPPR genes in the PLS subfamily and subgroups (B) DYW, (C) E2, (D) PLS, (E) E1, and (F) E+. Differences in transcript abundances such as high (red) and low (blue) levels are shown in color as the scale bar of Z-score.

