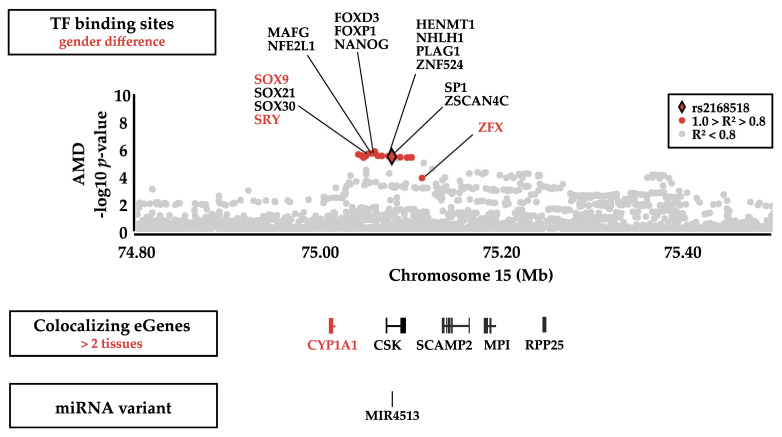
Figure 5.
Locus scheme of functional mechanisms within the AMD association signal. The Manhattan plot represents the association p-values with late-stage AMD. rs2168518 is highlighted as a red diamond and all variants strongly linked with rs2168518 (R2 > 0.8 in Europeans) are displayed as red dots. Potentially altered transcription factor (TF) binding sites are shown with regard to the approximate chromosomal position. TFs related to gender differences, due to their location on sex chromosomes (SRY and ZFX) or because they are direct target genes of TFs located on sex chromosomes (SOX9), are highlighted in red. Below the Manhattan Plot are schemes of eGenes colocalizing with the AMD association signal and eGenes are displayed in regard to their approximate chromosomal position. eGenes colocalizing with the AMD association signal in more than two tissues are highlighted in red. As rs2168518 is located within hsa-mir-4513, the chromosomal position of this microRNA (miRNA) is shown below the colocalizing eGenes with AMD. The raw version of the Manhattan Plot was created with Locuszoom [30].

