Figure 1.
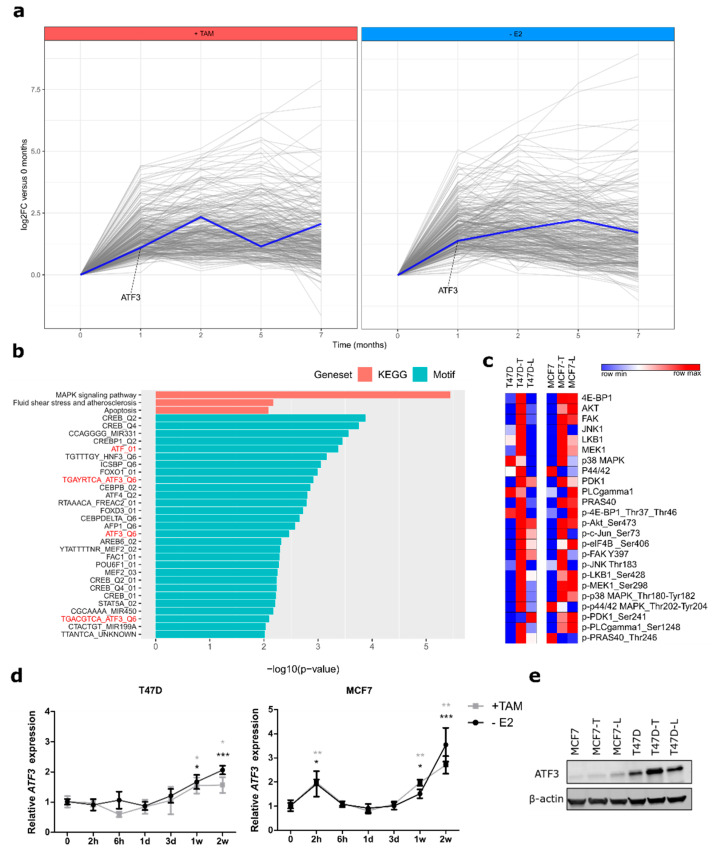
Time-resolved profiling identifies activating transcription factor 3 (ATF3) upregulation in early stages of resistance development. (a) Differentially upregulated genes after one or two months of treatment of T47D with 4-hydroxytamoxifen (TAM) (left panel) or E2 deprivation (right panel). ATF3 profile is highlighted in blue. RNA-seq values are represented as relative Log2 Fold Change compared to parental cells (b) Red: pathway enrichment analysis on the 282 commonly upregulated genes between TAM-treated and E2-deprived cells using KEGG (Kyoto Encyclopedia of Genes and Genomes) pathways. Blue: putative transcription factors binding analysis on the 282 commonly upregulated genes between TAM-treated and E2-deprived cells using Molecular Signature Database C3 motifs collection. (c) Heatmaps of 24 total proteins and phospho-proteins involved in MAPK and PI3K/AKT signaling pathways in T47D and MCF7 sensitive and resistant cells. Log2 normalized signal intensities for each protein are plotted and color-coding refers to relative intensities in each row independently. (d) Relative ATF3 mRNA levels determined by qRT-PCR in T47D and MCF7 treated for two weeks with either TAM or E2 deprivation. (e) ATF3 protein levels in sensitive and resistant T47D and MCF7 determined by WB after 2h anisomycin stimulation. β-actin levels are used as loading control. qRT-PCR data are normalized to ACTB and then to untreated cells and represented as mean + SEM, n = 3. *** p-value < 0.001, ** p-value < 0.01, * p-value < 0.05.

